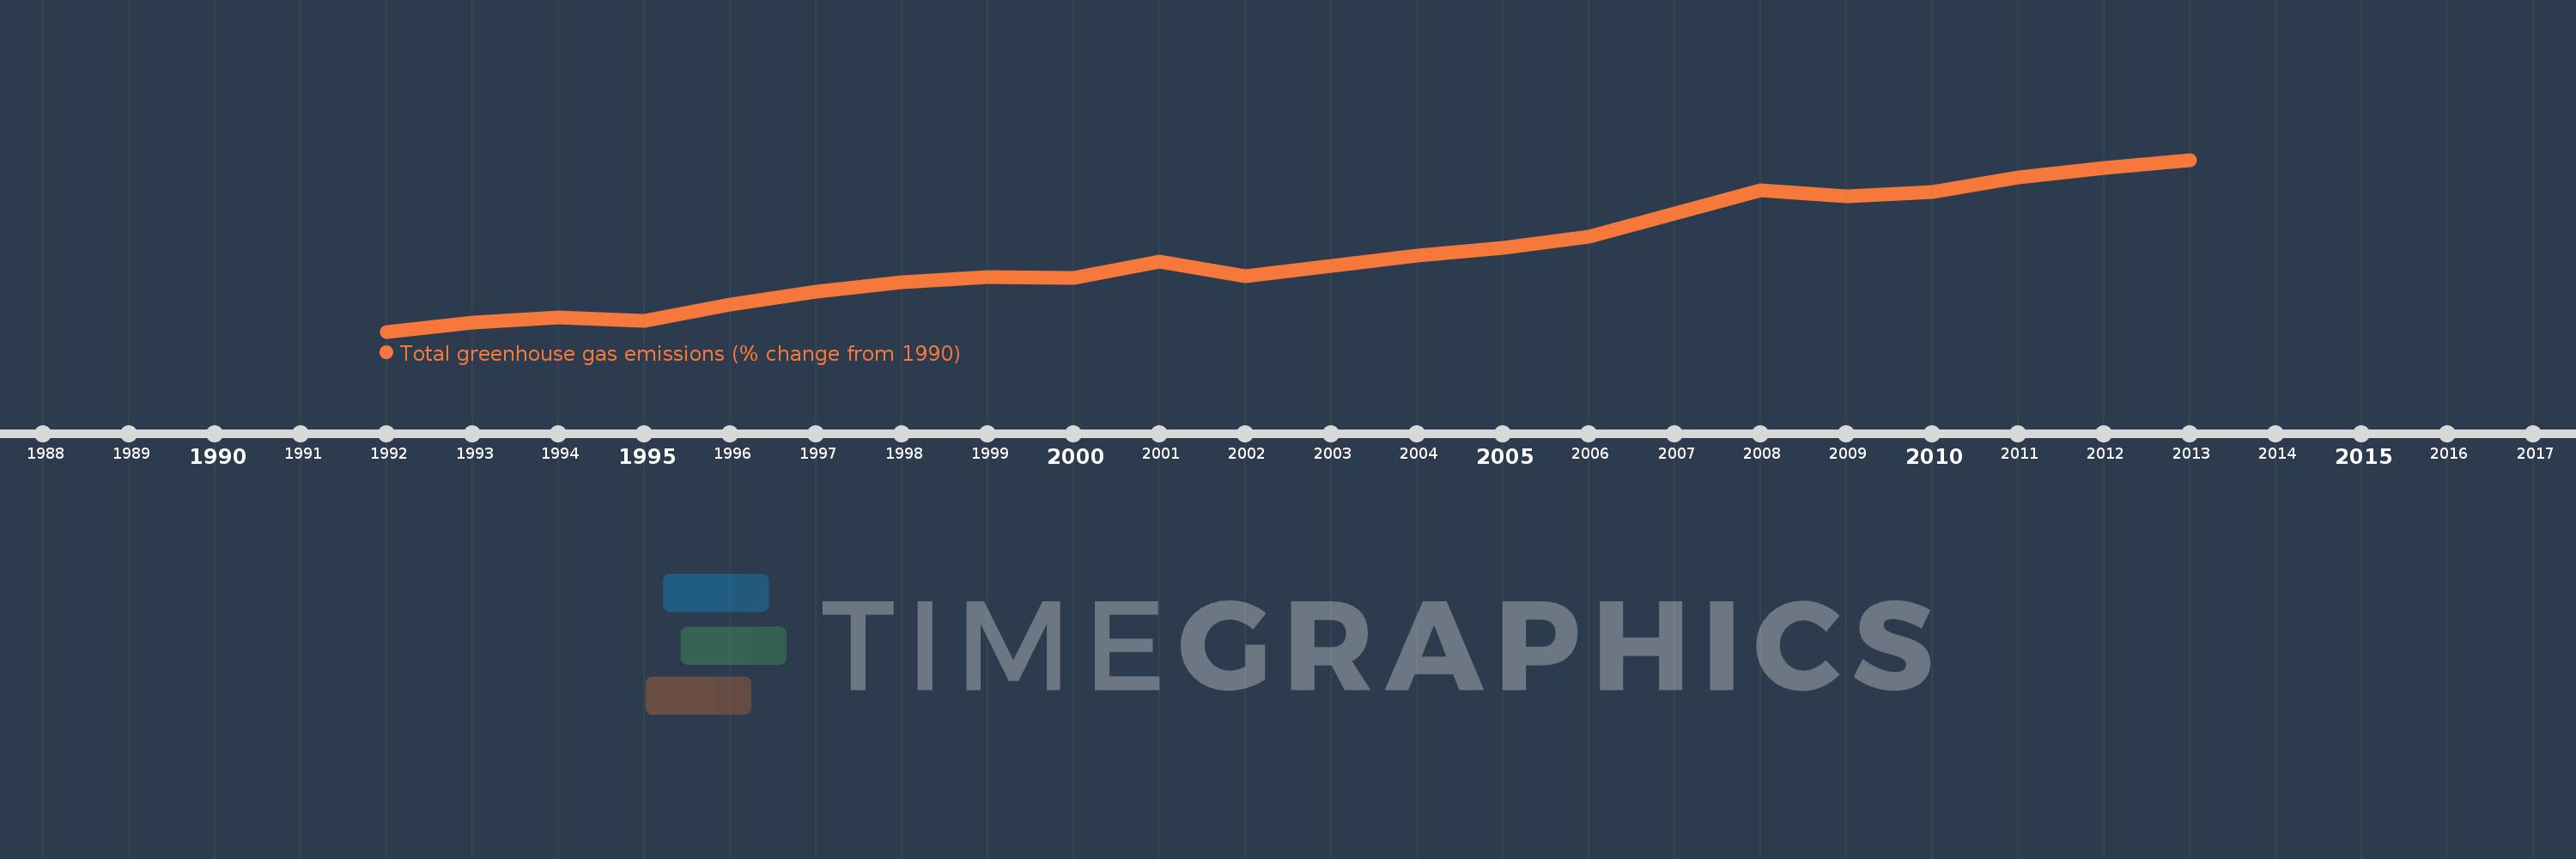
This timeline shows a graph from 1992 to 2013 of Turkey. No data until 1991. Number of actual observations by date: 22.
Source name:
World Development Indicators
Source organization:
World Bank staff estimates from original source: European Commission, Joint Research Centre (JRC)/Netherlands Environmental Assessment Agency (PBL). Emission Database for Global Atmospheric Research (EDGAR): http://edgar.jrc.ec.europa.eu/.
Categories, topics:
Climate Change, Environment
Last updated:
apr 23, 2017
Indicators value changes by year
Meaning:
45.606
Minimum:
1.011
jan 1, 1992
Maximum:
98.54
jan 1, 2013
At the date of observation
Value
Absolute change
Change from the previous value
jan 1, 1992
1.011
+1.011
0.0%
jan 1, 1993
5.991
+4.98
492.56%
jan 1, 1994
9.107
+3.116
52.02%
jan 1, 1995
7.322
-1.786
-19.61%
jan 1, 1996
16.37
+9.048
123.58%
jan 1, 1997
23.854
+7.483
45.71%
jan 1, 1998
29.057
+5.204
21.82%
jan 1, 1999
31.821
+2.764
9.51%
jan 1, 2000
31.674
-0.148
-0.46%
jan 1, 2001
40.99
+9.316
29.41%
jan 1, 2002
32.569
-8.421
-20.54%
jan 1, 2003
38.137
+5.568
17.09%
jan 1, 2004
44.25
+6.112
16.03%
jan 1, 2005
48.578
+4.329
9.78%
jan 1, 2006
54.859
+6.281
12.93%
jan 1, 2007
68.029
+13.17
24.01%
jan 1, 2008
81.012
+12.983
19.08%
jan 1, 2009
77.842
-3.17
-3.91%
jan 1, 2010
80.272
+2.43
3.12%
jan 1, 2011
88.329
+8.057
10.04%
jan 1, 2012
93.709
+5.38
6.09%
jan 1, 2013
98.54
+4.83
5.15%
Ranking of countries by current statistics by years