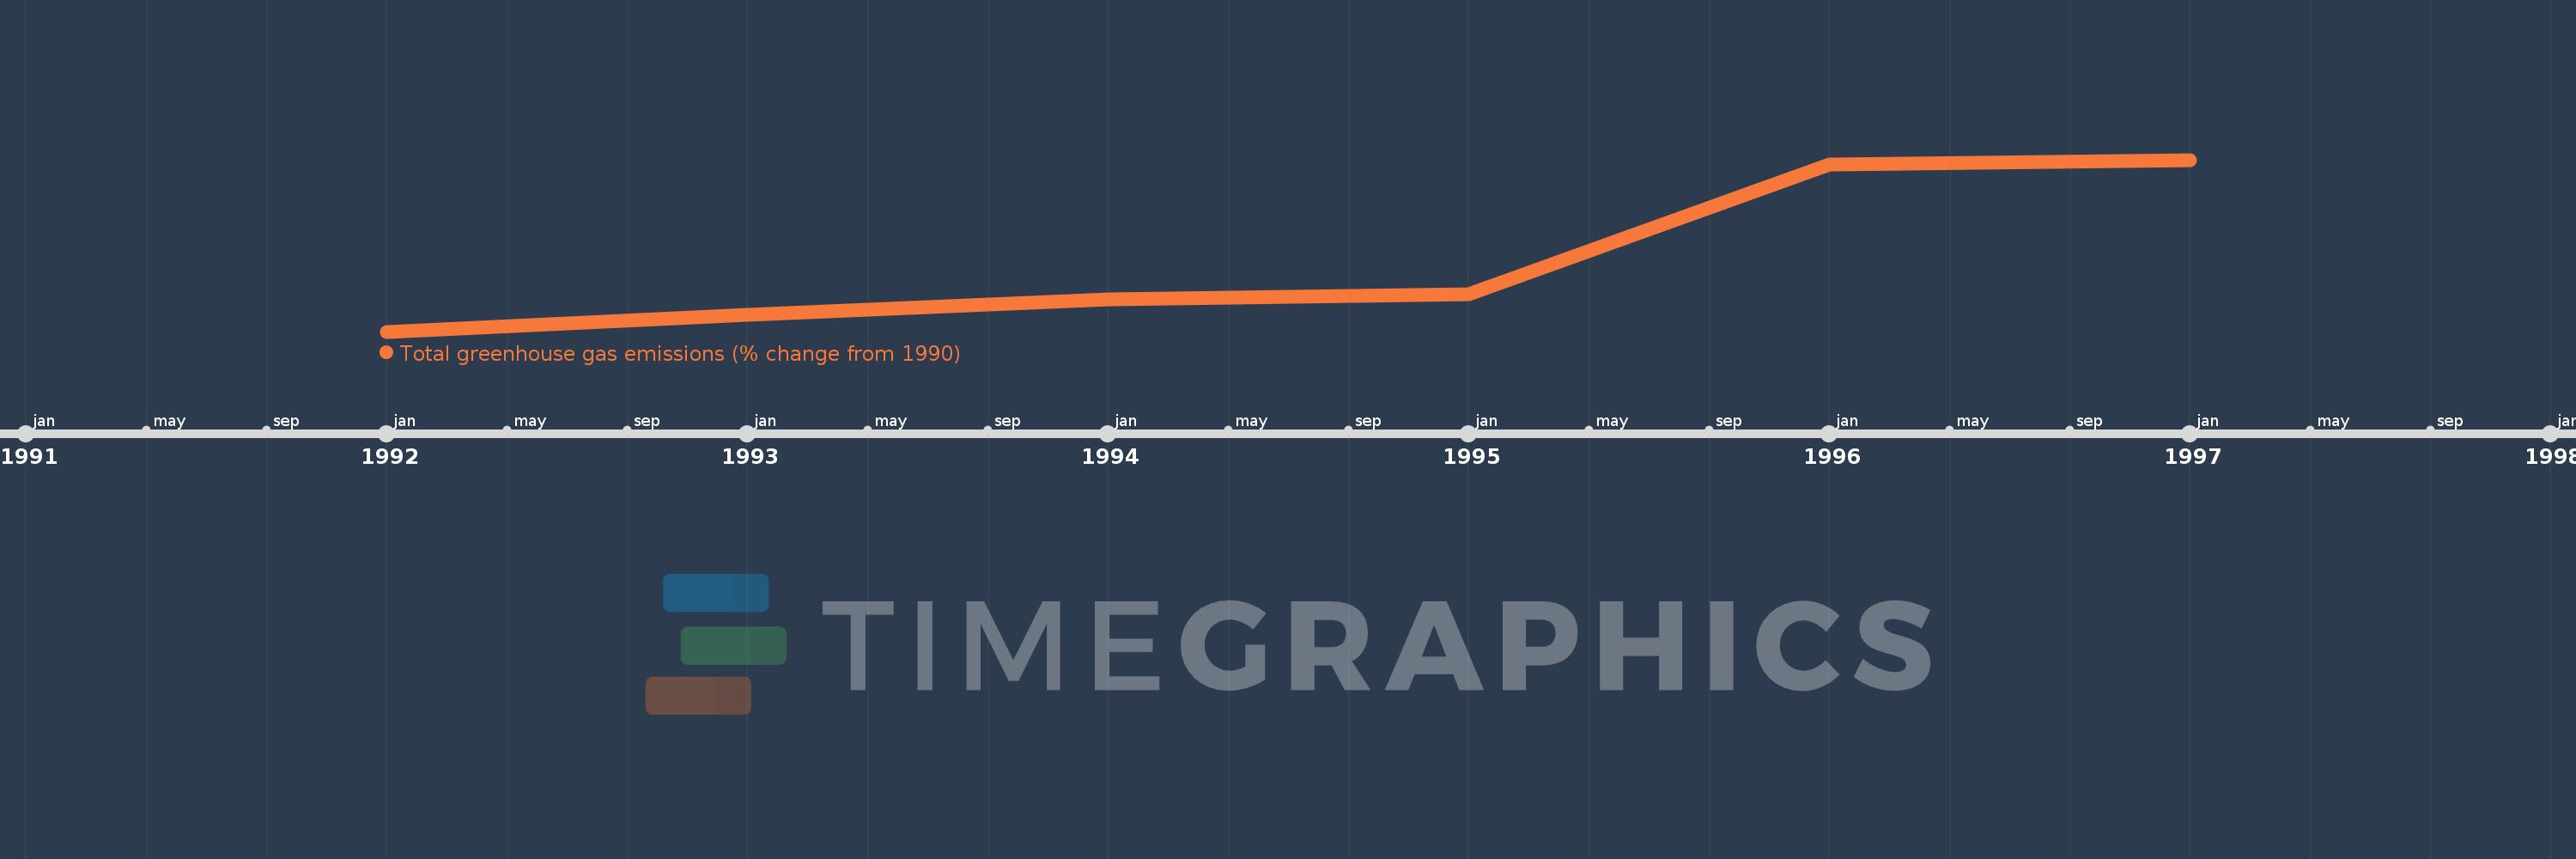
This timeline shows a graph from 1992 to 1997 of Micronesia, Fed. Sts.. No data until 1991. Number of actual observations by date: 6.
Source name:
World Development Indicators
Source organization:
World Bank staff estimates from original source: European Commission, Joint Research Centre (JRC)/Netherlands Environmental Assessment Agency (PBL). Emission Database for Global Atmospheric Research (EDGAR): http://edgar.jrc.ec.europa.eu/.
Categories, topics:
Climate Change, Environment
Last updated:
apr 23, 2017
Indicators value changes by year
Meaning:
10.142
Minimum:
1.848
jan 1, 1992
Maximum:
21.947
jan 1, 1997
At the date of observation
Value
Absolute change
Change from the previous value
jan 1, 1992
1.848
+1.848
0.0%
jan 1, 1993
3.76
+1.912
103.46%
jan 1, 1994
5.637
+1.877
49.93%
jan 1, 1995
6.268
+0.631
11.19%
jan 1, 1996
21.392
+15.124
241.3%
jan 1, 1997
21.947
+0.555
2.6%
Ranking of countries by current statistics by years