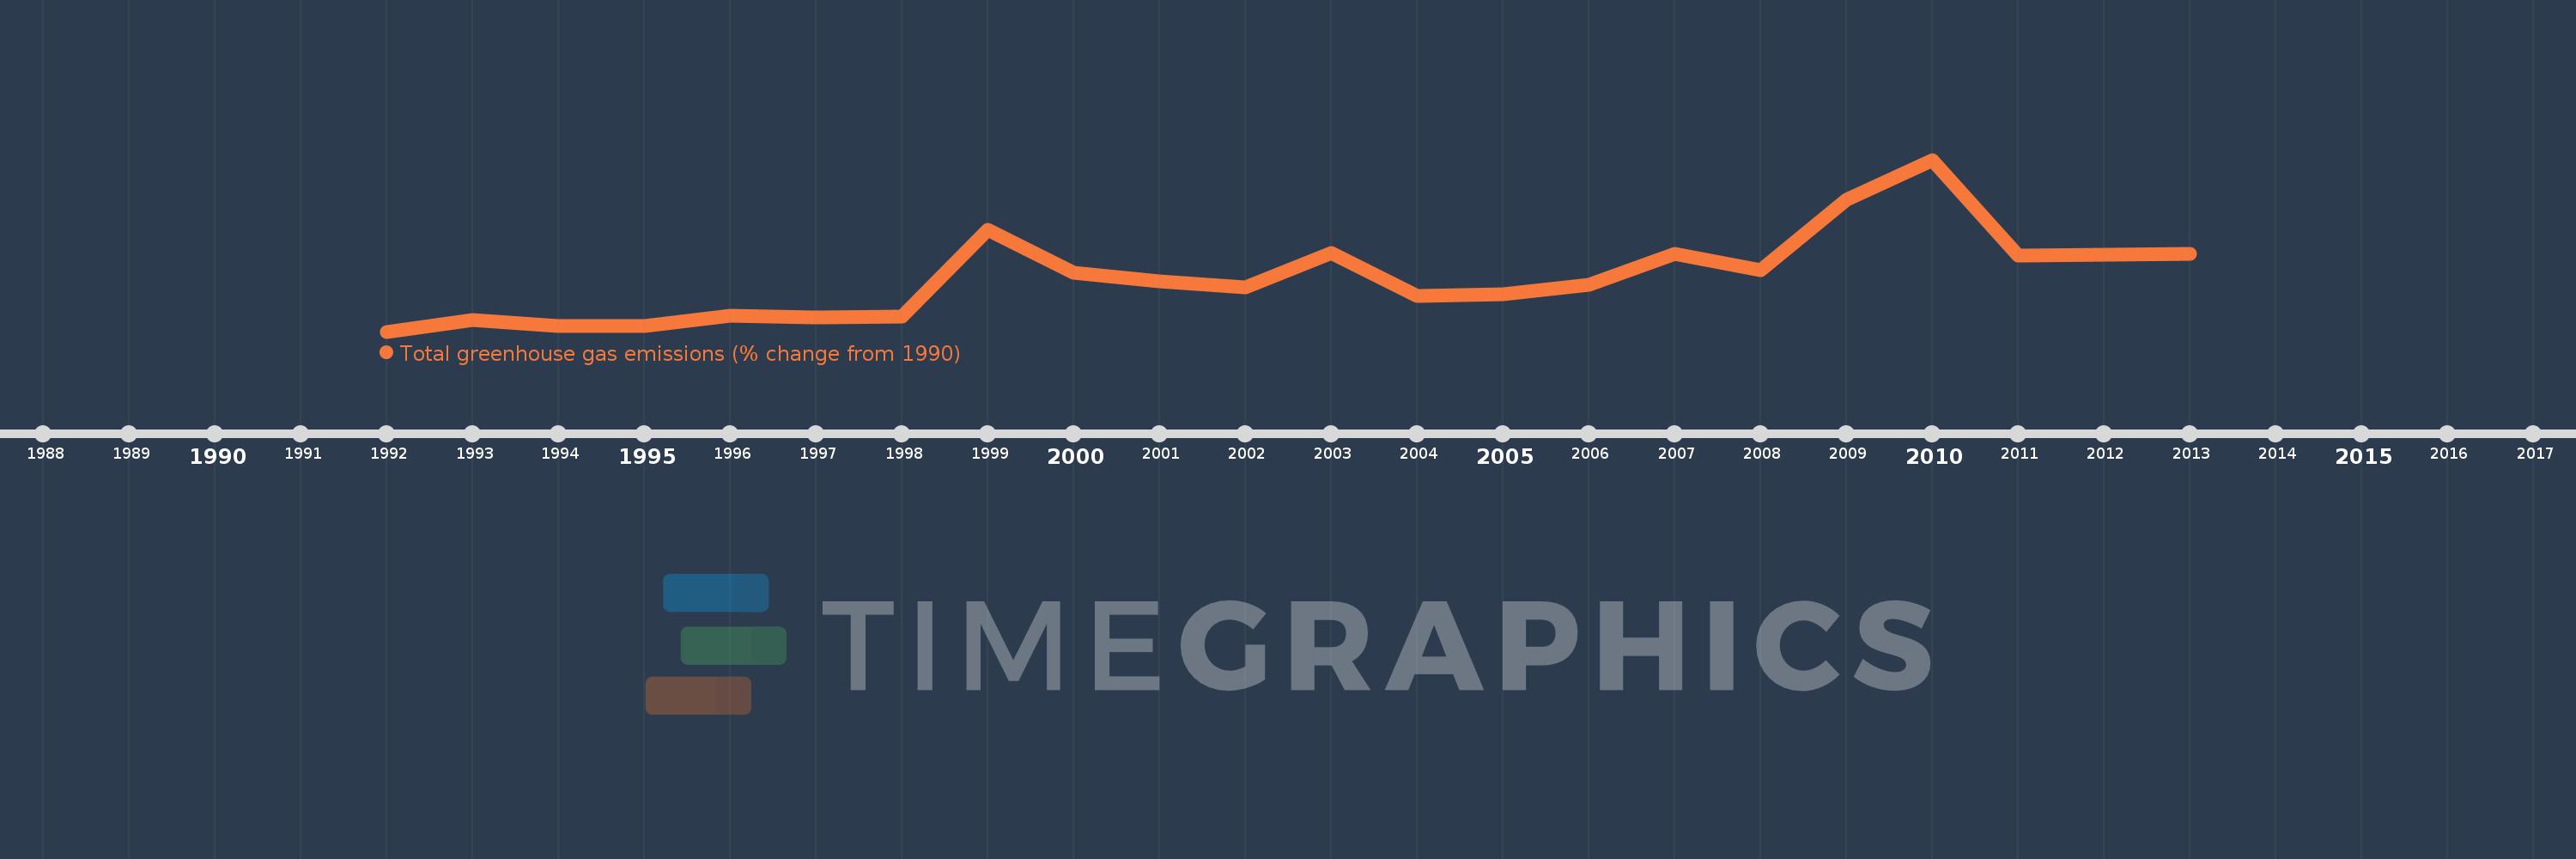
This timeline shows a graph from 1992 to 2013 of Guinea. No data until 1991. Number of actual observations by date: 22.
Source name:
World Development Indicators
Source organization:
World Bank staff estimates from original source: European Commission, Joint Research Centre (JRC)/Netherlands Environmental Assessment Agency (PBL). Emission Database for Global Atmospheric Research (EDGAR): http://edgar.jrc.ec.europa.eu/.
Categories, topics:
Climate Change, Environment
Last updated:
apr 23, 2017
Indicators value changes by year
Meaning:
33.138
Minimum:
-18.888
jan 1, 1992
Maximum:
145.835
jan 1, 2010
At the date of observation
Value
Absolute change
Change from the previous value
jan 1, 1992
-18.888
-18.888
0.0%
jan 1, 1993
-7.893
+10.994
-58.21%
jan 1, 1994
-13.517
-5.624
71.24%
jan 1, 1995
-13.571
-0.054
0.4%
jan 1, 1996
-4.041
+9.53
-70.23%
jan 1, 1997
-5.253
-1.212
30.0%
jan 1, 1998
-4.612
+0.641
-12.2%
jan 1, 1999
78.511
+83.123
-1.8K%
jan 1, 2000
37.884
-40.627
-51.75%
jan 1, 2001
29.445
-8.439
-22.28%
jan 1, 2002
23.207
-6.238
-21.19%
jan 1, 2003
56.87
+33.664
145.06%
jan 1, 2004
15.186
-41.685
-73.3%
jan 1, 2005
17.04
+1.855
12.21%
jan 1, 2006
25.705
+8.664
50.85%
jan 1, 2007
55.739
+30.035
116.85%
jan 1, 2008
39.828
-15.911
-28.55%
jan 1, 2009
107.498
+67.67
169.9%
jan 1, 2010
145.835
+38.337
35.66%
jan 1, 2011
53.864
-91.971
-63.07%
jan 1, 2012
54.693
+0.829
1.54%
jan 1, 2013
55.513
+0.82
1.5%
Ranking of countries by current statistics by years