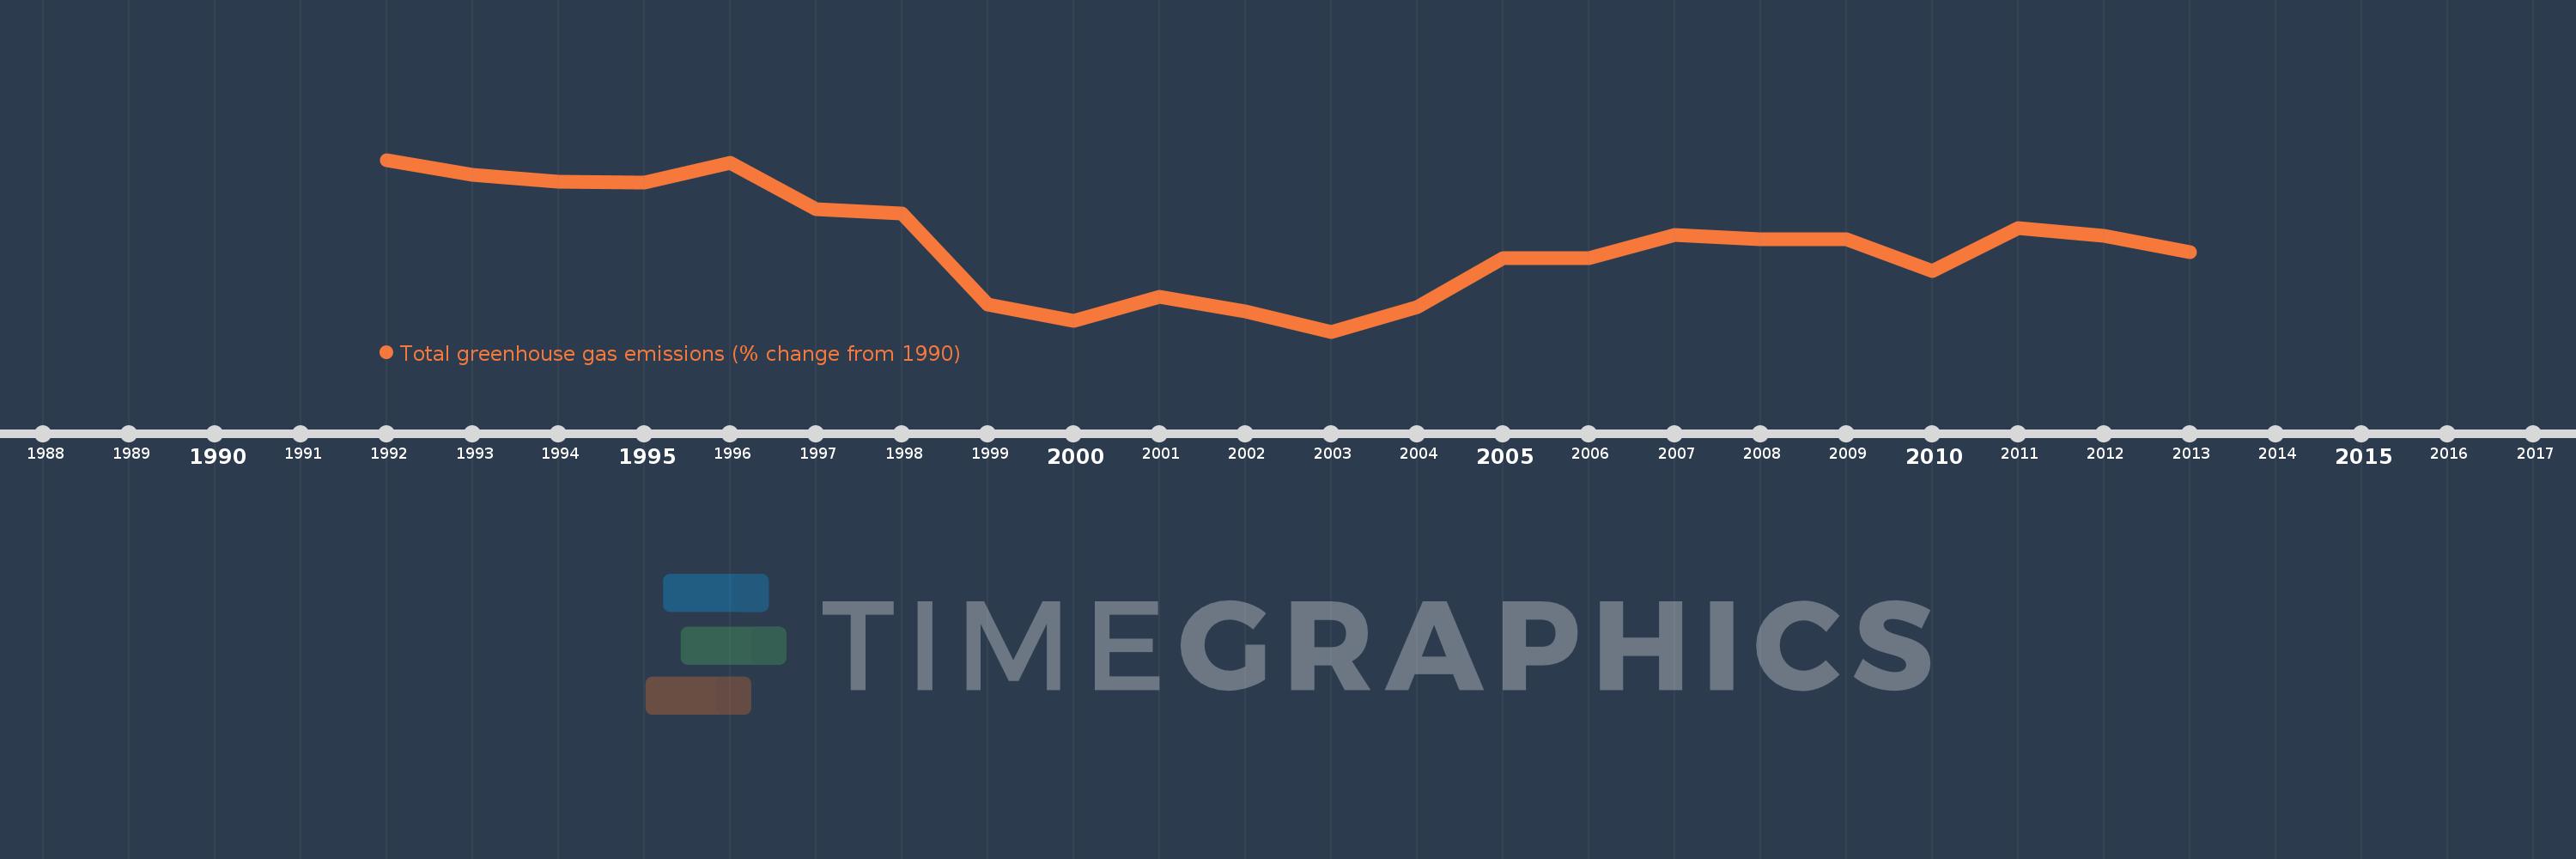
This timeline shows a graph from 1992 to 2013 of Poland. No data until 1991. Number of actual observations by date: 22.
Source name:
World Development Indicators
Source organization:
World Bank staff estimates from original source: European Commission, Joint Research Centre (JRC)/Netherlands Environmental Assessment Agency (PBL). Emission Database for Global Atmospheric Research (EDGAR): http://edgar.jrc.ec.europa.eu/.
Categories, topics:
Climate Change, Environment
Last updated:
apr 23, 2017
Indicators value changes by year
Meaning:
-11.698
Minimum:
-20.753
jan 1, 2003
Maximum:
-2.932
jan 1, 1992
At the date of observation
Value
Absolute change
Change from the previous value
jan 1, 1992
-2.932
-2.932
0.0%
jan 1, 1993
-4.528
-1.596
54.42%
jan 1, 1994
-5.181
-0.653
14.43%
jan 1, 1995
-5.305
-0.123
2.38%
jan 1, 1996
-3.261
+2.043
-38.52%
jan 1, 1997
-8.094
-4.833
148.19%
jan 1, 1998
-8.539
-0.445
5.5%
jan 1, 1999
-17.955
-9.416
110.27%
jan 1, 2000
-19.656
-1.701
9.47%
jan 1, 2001
-17.167
+2.489
-12.66%
jan 1, 2002
-18.641
-1.474
8.59%
jan 1, 2003
-20.753
-2.112
11.33%
jan 1, 2004
-18.227
+2.526
-12.17%
jan 1, 2005
-13.117
+5.11
-28.03%
jan 1, 2006
-13.123
-0.006
0.05%
jan 1, 2007
-10.701
+2.422
-18.45%
jan 1, 2008
-11.148
-0.446
4.17%
jan 1, 2009
-11.188
-0.041
0.37%
jan 1, 2010
-14.471
-3.283
29.34%
jan 1, 2011
-10.027
+4.444
-30.71%
jan 1, 2012
-10.807
-0.779
7.77%
jan 1, 2013
-12.533
-1.727
15.98%
Ranking of countries by current statistics by years