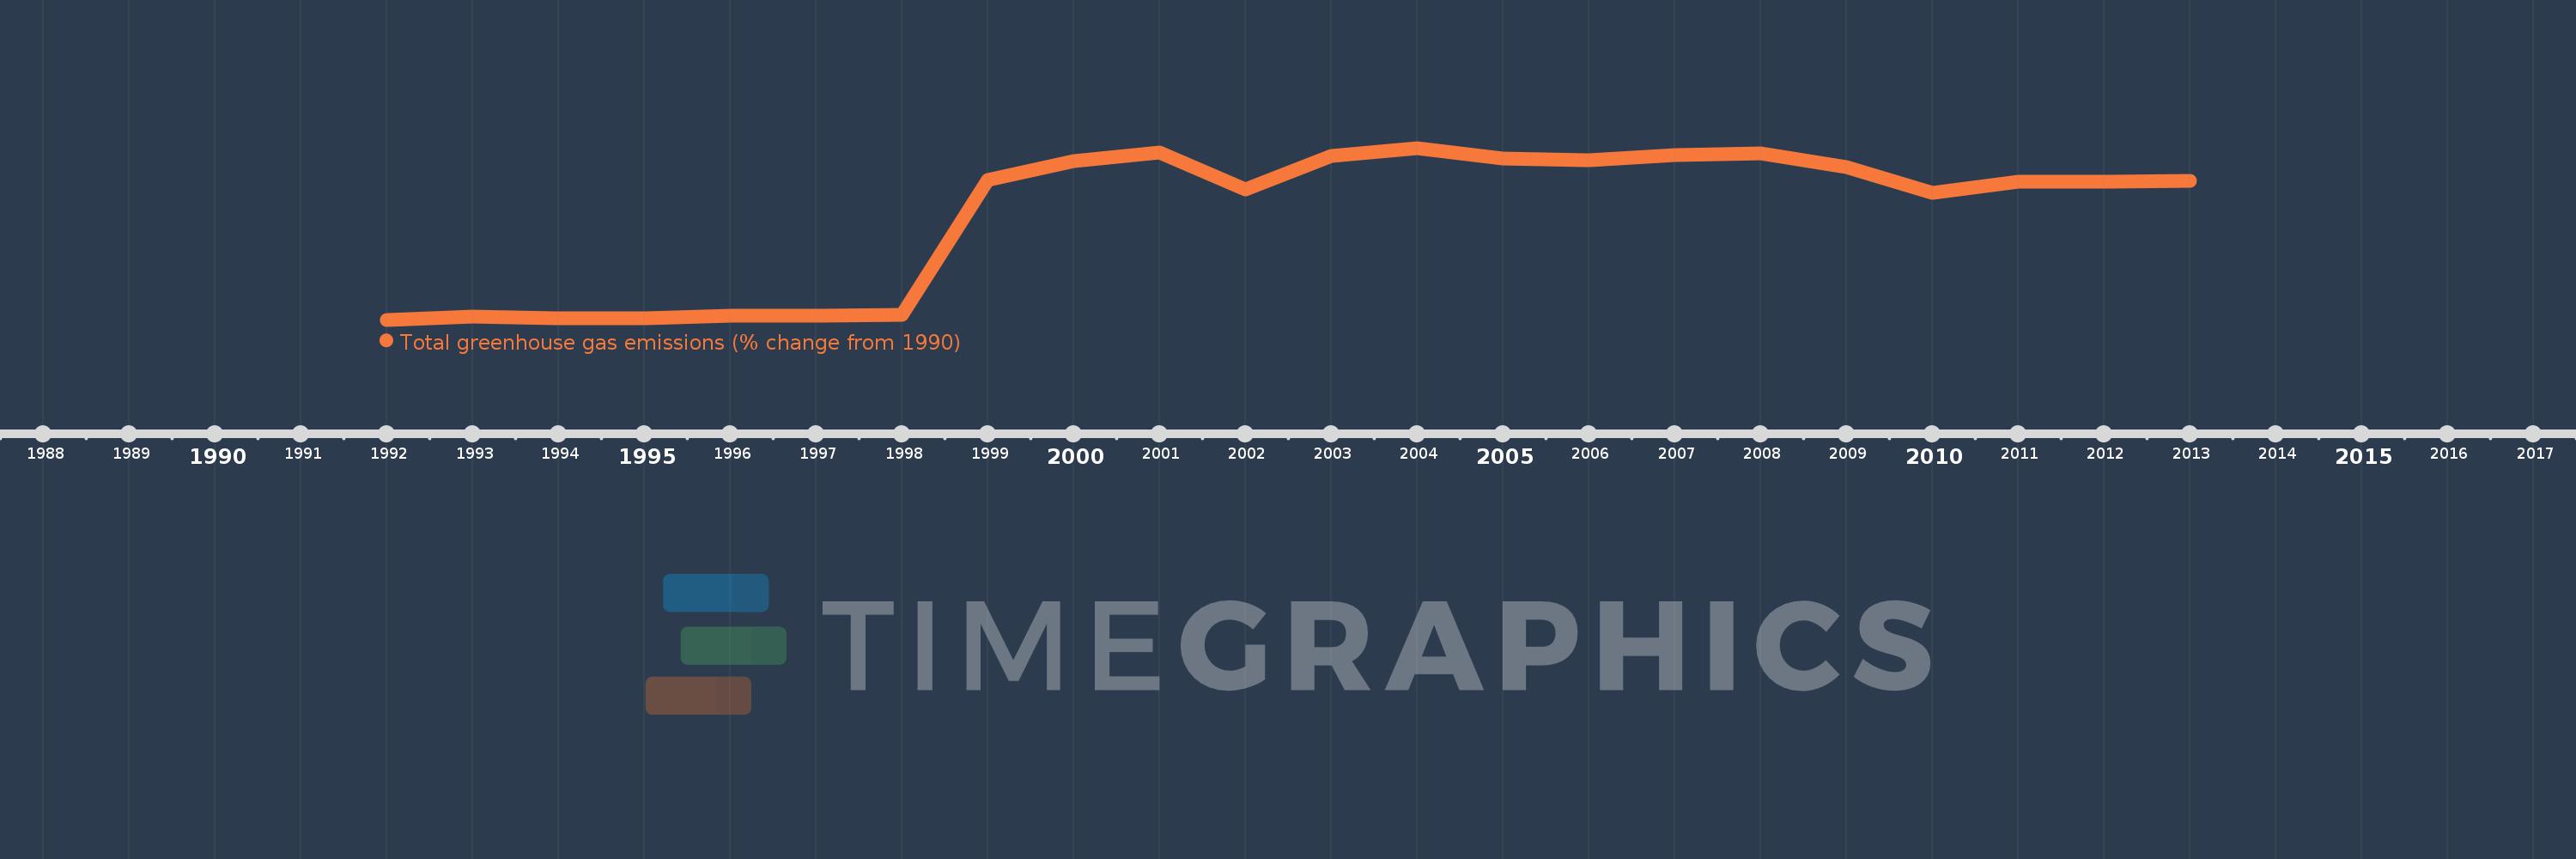
This timeline shows a graph from 1992 to 2013 of Chad. No data until 1991. Number of actual observations by date: 22.
Source name:
World Development Indicators
Source organization:
World Bank staff estimates from original source: European Commission, Joint Research Centre (JRC)/Netherlands Environmental Assessment Agency (PBL). Emission Database for Global Atmospheric Research (EDGAR): http://edgar.jrc.ec.europa.eu/.
Categories, topics:
Climate Change, Environment
Last updated:
apr 23, 2017
Indicators value changes by year
Meaning:
371.434
Minimum:
-16.712
jan 1, 1992
Maximum:
622.146
jan 1, 2004
At the date of observation
Value
Absolute change
Change from the previous value
jan 1, 1992
-16.712
-16.712
0.0%
jan 1, 1993
-5.68
+11.032
-66.01%
jan 1, 1994
-11.101
-5.42
95.42%
jan 1, 1995
-11.14
-0.039
0.35%
jan 1, 1996
-2.195
+8.944
-80.29%
jan 1, 1997
-3.042
-0.846
38.54%
jan 1, 1998
2.97
+6.011
-197.65%
jan 1, 1999
501.572
+498.602
16.79K%
jan 1, 2000
574.405
+72.833
14.52%
jan 1, 2001
604.797
+30.392
5.29%
jan 1, 2002
467.814
-136.983
-22.65%
jan 1, 2003
593.547
+125.733
26.88%
jan 1, 2004
622.146
+28.6
4.82%
jan 1, 2005
582.295
-39.851
-6.41%
jan 1, 2006
575.477
-6.818
-1.17%
jan 1, 2007
596.067
+20.59
3.58%
jan 1, 2008
601.246
+5.179
0.87%
jan 1, 2009
551.96
-49.286
-8.2%
jan 1, 2010
456.385
-95.575
-17.32%
jan 1, 2011
495.096
+38.711
8.48%
jan 1, 2012
496.913
+1.817
0.37%
jan 1, 2013
498.726
+1.812
0.36%
Ranking of countries by current statistics by years