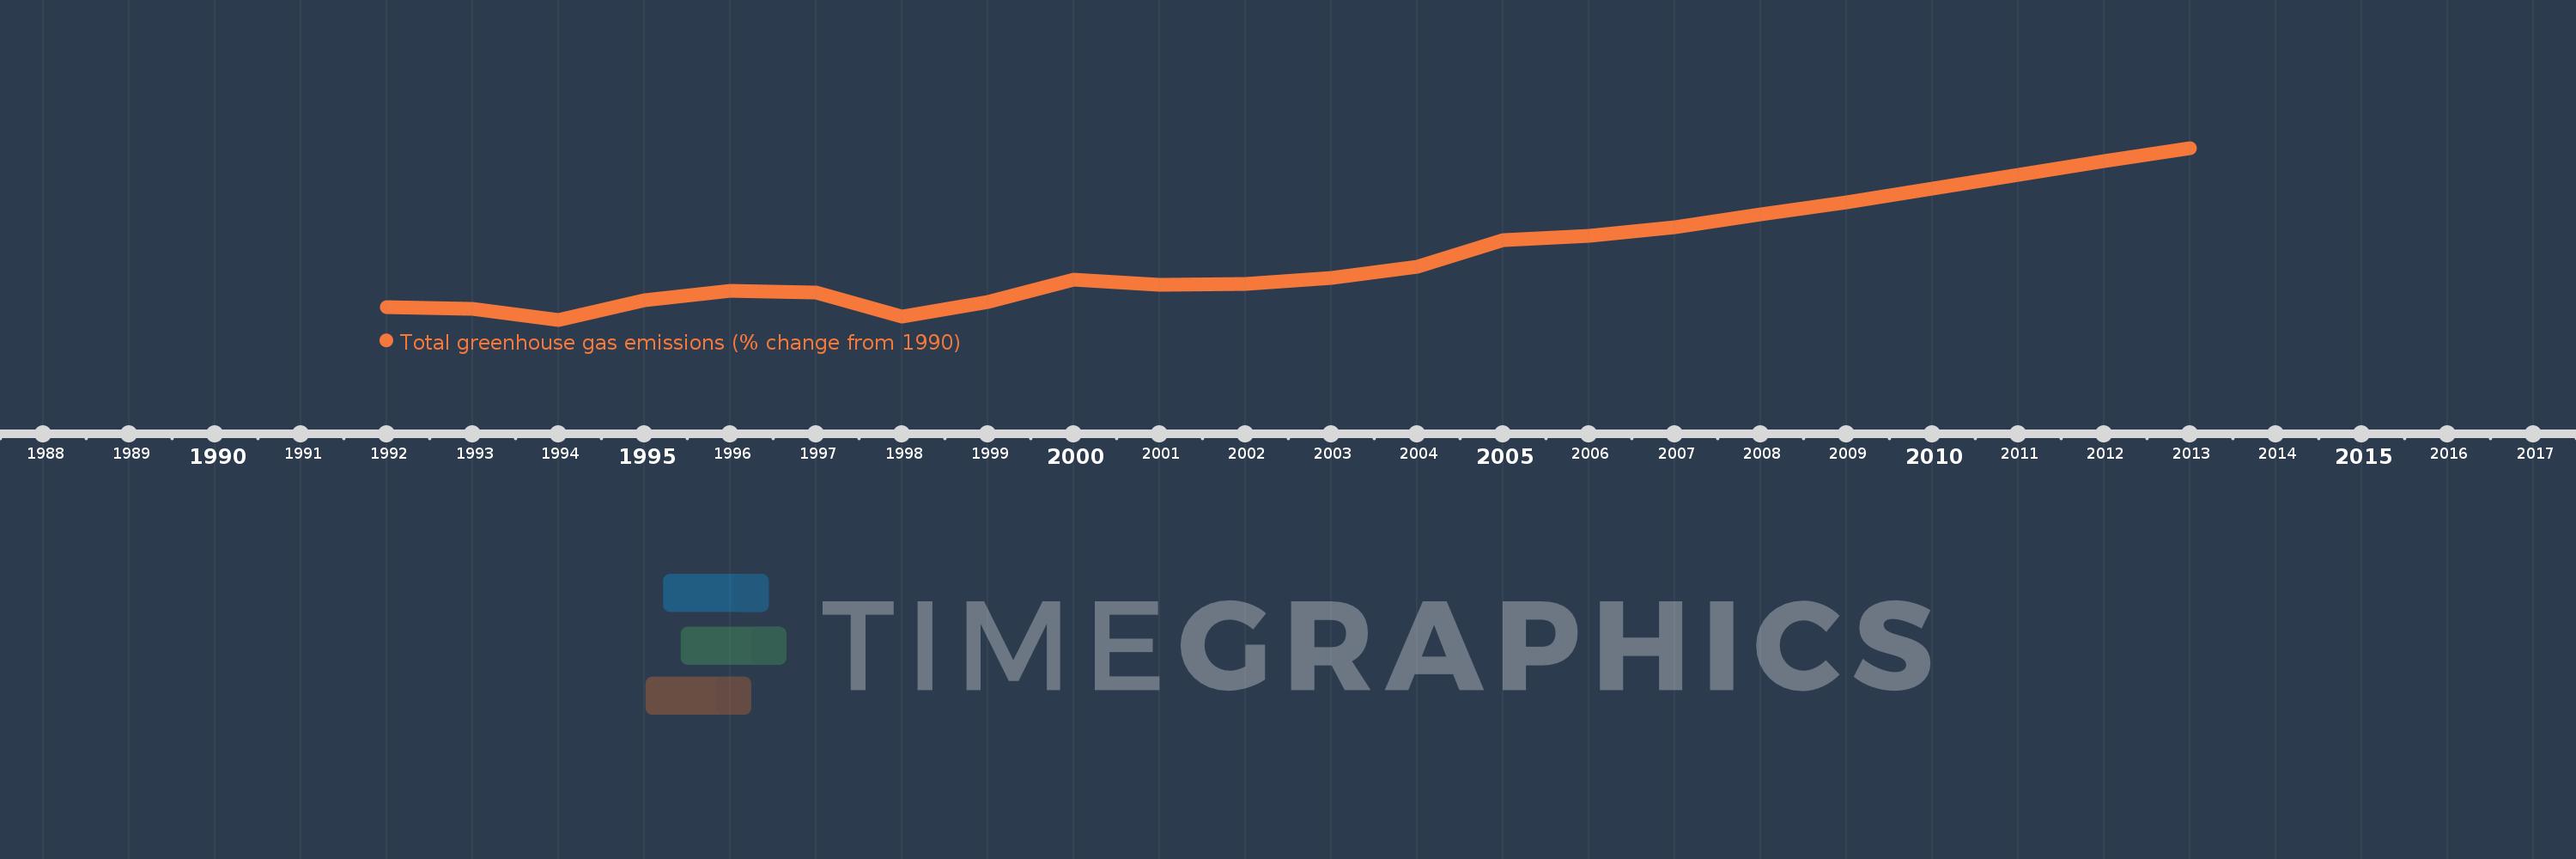
This timeline shows a graph from 1992 to 2013 of Antigua and Barbuda. No data until 1991. Number of actual observations by date: 20.
Source name:
World Development Indicators
Source organization:
World Bank staff estimates from original source: European Commission, Joint Research Centre (JRC)/Netherlands Environmental Assessment Agency (PBL). Emission Database for Global Atmospheric Research (EDGAR): http://edgar.jrc.ec.europa.eu/.
Categories, topics:
Climate Change, Environment
Last updated:
apr 23, 2017
Indicators value changes by year
Meaning:
13.665
Minimum:
-3.517
jan 1, 1994
Maximum:
48.473
jan 1, 2013
At the date of observation
Value
Absolute change
Change from the previous value
jan 1, 1992
0.288
+0.288
0.0%
jan 1, 1993
-0.206
-0.494
-171.76%
jan 1, 1994
-3.517
-3.311
1.6K%
jan 1, 1995
2.3
+5.817
-165.41%
jan 1, 1996
5.28
+2.98
129.53%
jan 1, 1997
4.76
-0.52
-9.84%
jan 1, 1998
-2.661
-7.421
-155.9%
jan 1, 1999
1.916
+4.577
-172.01%
jan 1, 2000
8.545
+6.629
345.91%
jan 1, 2001
7.093
-1.452
-16.99%
jan 1, 2002
7.246
+0.153
2.16%
jan 1, 2003
9.171
+1.925
26.57%
jan 1, 2004
12.504
+3.332
36.33%
jan 1, 2005
20.606
+8.102
64.8%
jan 1, 2006
21.968
+1.361
6.61%
jan 1, 2007
24.518
+2.55
11.61%
jan 1, 2008
28.418
+3.9
15.91%
jan 1, 2009
32.128
+3.71
13.06%
jan 1, 2012
44.46
+12.331
38.38%
jan 1, 2013
48.473
+4.014
9.03%
Ranking of countries by current statistics by years