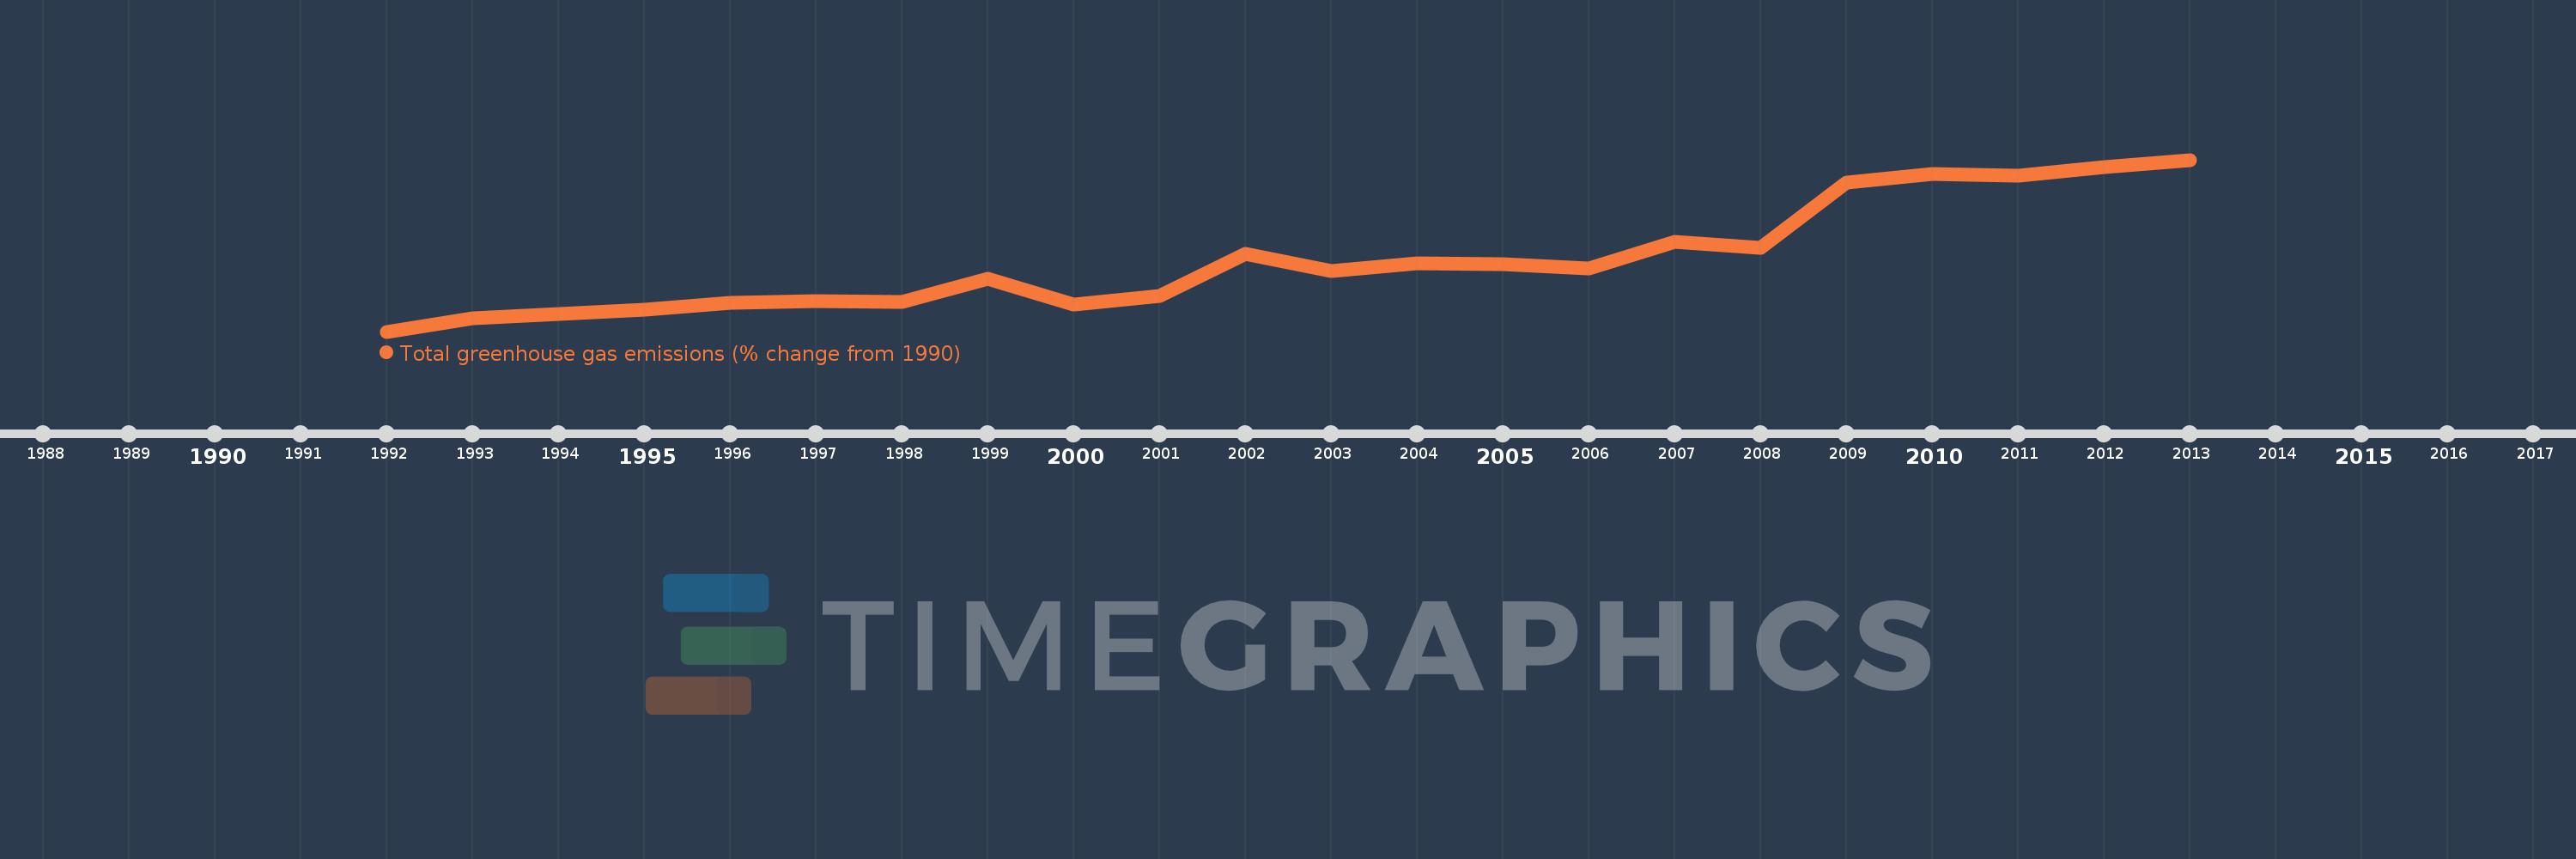
This timeline shows a graph from 1992 to 2013 of Panama. No data until 1991. Number of actual observations by date: 22.
Source name:
World Development Indicators
Source organization:
World Bank staff estimates from original source: European Commission, Joint Research Centre (JRC)/Netherlands Environmental Assessment Agency (PBL). Emission Database for Global Atmospheric Research (EDGAR): http://edgar.jrc.ec.europa.eu/.
Categories, topics:
Climate Change, Environment
Last updated:
apr 23, 2017
Indicators value changes by year
Meaning:
61.701
Minimum:
7.268
jan 1, 1992
Maximum:
138.446
jan 1, 2013
At the date of observation
Value
Absolute change
Change from the previous value
jan 1, 1992
7.268
+7.268
0.0%
jan 1, 1993
17.719
+10.451
143.79%
jan 1, 1994
20.515
+2.796
15.78%
jan 1, 1995
24.312
+3.797
18.51%
jan 1, 1996
29.396
+5.083
20.91%
jan 1, 1997
30.474
+1.079
3.67%
jan 1, 1998
30.172
-0.303
-0.99%
jan 1, 1999
47.785
+17.613
58.38%
jan 1, 2000
28.209
-19.576
-40.97%
jan 1, 2001
34.402
+6.193
21.96%
jan 1, 2002
66.377
+31.975
92.94%
jan 1, 2003
53.73
-12.647
-19.05%
jan 1, 2004
59.227
+5.497
10.23%
jan 1, 2005
58.766
-0.462
-0.78%
jan 1, 2006
55.385
-3.381
-5.75%
jan 1, 2007
75.917
+20.532
37.07%
jan 1, 2008
71.535
-4.382
-5.77%
jan 1, 2009
121.332
+49.798
69.61%
jan 1, 2010
127.304
+5.971
4.92%
jan 1, 2011
126.412
-0.891
-0.7%
jan 1, 2012
132.747
+6.335
5.01%
jan 1, 2013
138.446
+5.698
4.29%
Ranking of countries by current statistics by years