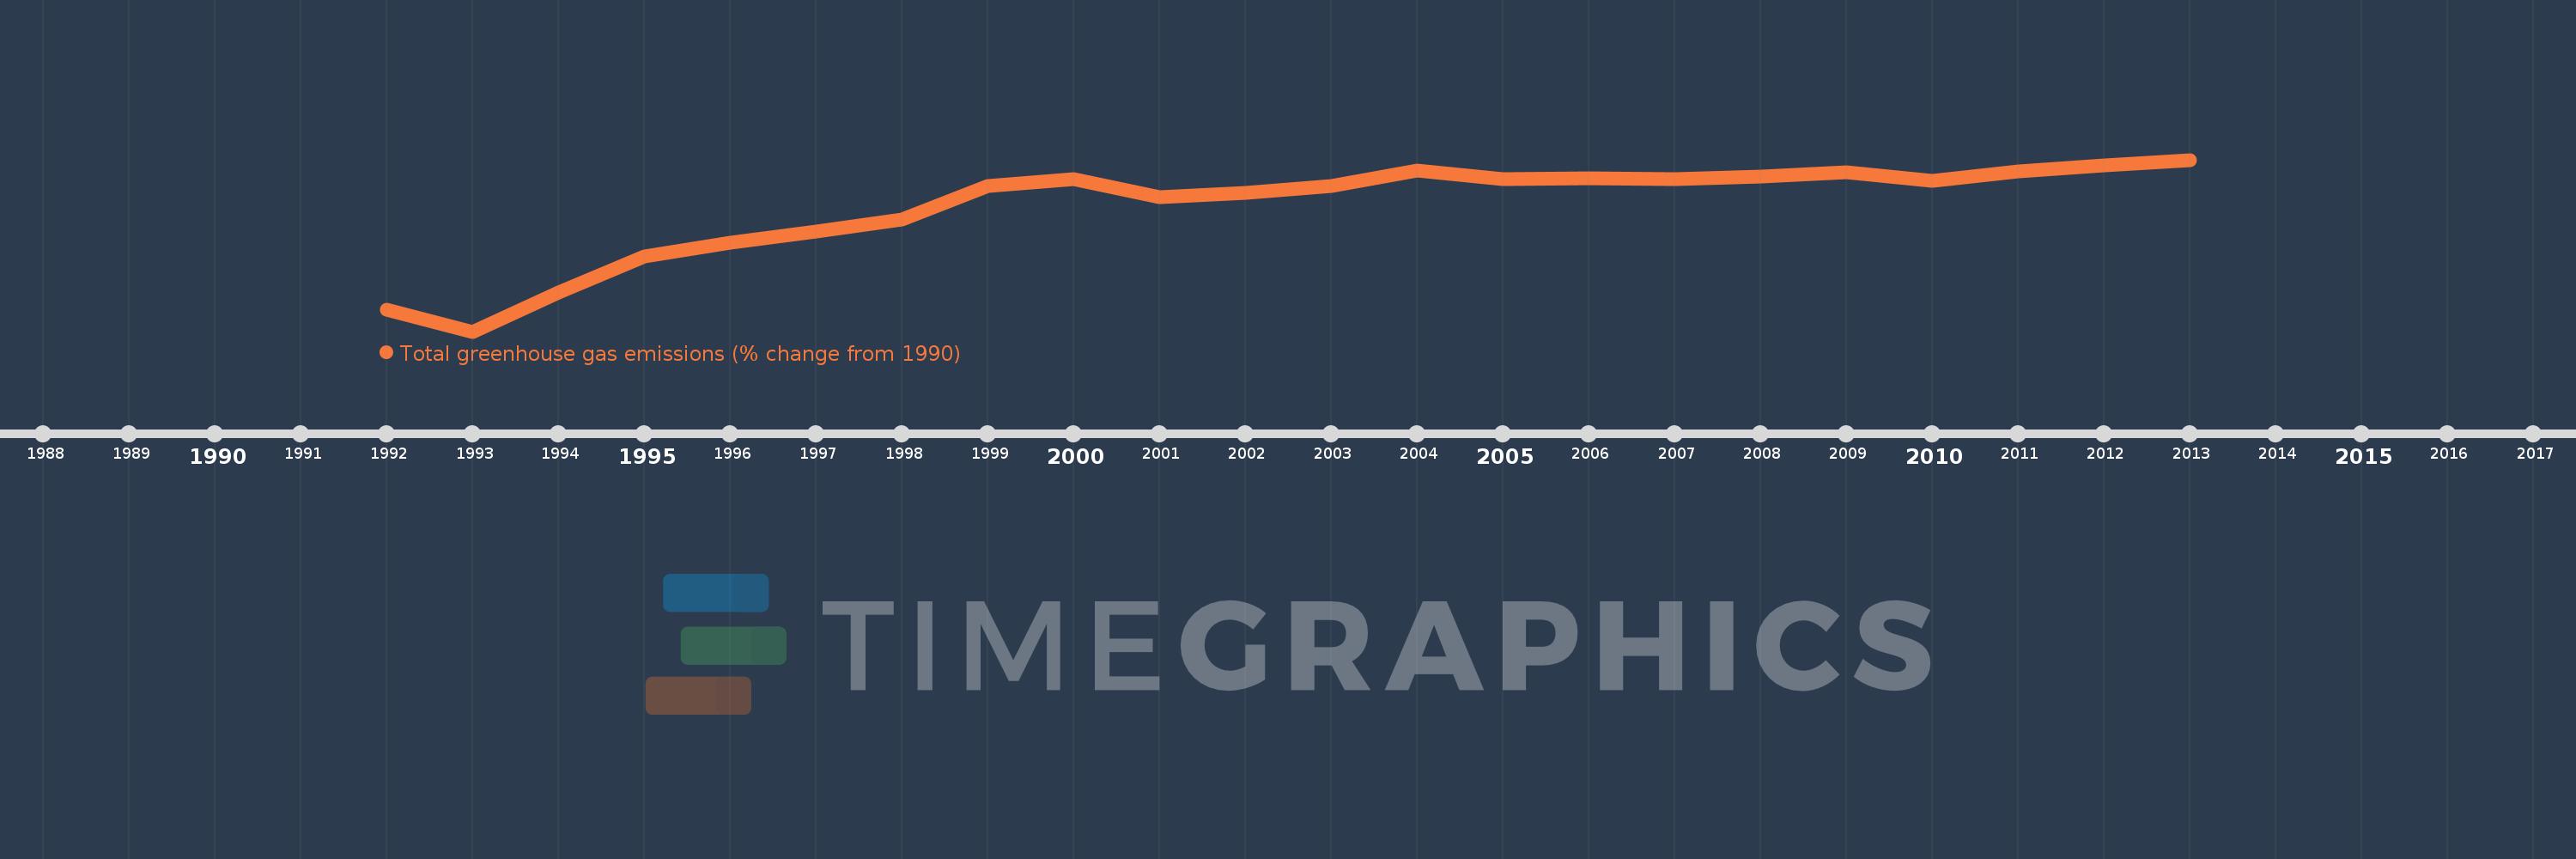
This timeline shows a graph from 1992 to 2013 of Somalia. No data until 1991. Number of actual observations by date: 22.
Source name:
World Development Indicators
Source organization:
World Bank staff estimates from original source: European Commission, Joint Research Centre (JRC)/Netherlands Environmental Assessment Agency (PBL). Emission Database for Global Atmospheric Research (EDGAR): http://edgar.jrc.ec.europa.eu/.
Categories, topics:
Climate Change, Environment
Last updated:
apr 23, 2017
Indicators value changes by year
Meaning:
12.05
Minimum:
-14.256
jan 1, 1993
Maximum:
22.073
jan 1, 2013
At the date of observation
Value
Absolute change
Change from the previous value
jan 1, 1992
-9.646
-9.646
0.0%
jan 1, 1993
-14.256
-4.61
47.79%
jan 1, 1994
-5.901
+8.354
-58.6%
jan 1, 1995
1.668
+7.57
-128.27%
jan 1, 1996
4.507
+2.839
170.17%
jan 1, 1997
6.978
+2.471
54.81%
jan 1, 1998
9.466
+2.488
35.65%
jan 1, 1999
16.523
+7.057
74.56%
jan 1, 2000
18.005
+1.482
8.97%
jan 1, 2001
14.138
-3.867
-21.48%
jan 1, 2002
15.017
+0.879
6.22%
jan 1, 2003
16.474
+1.456
9.7%
jan 1, 2004
19.847
+3.373
20.48%
jan 1, 2005
18.044
-1.803
-9.09%
jan 1, 2006
18.194
+0.151
0.84%
jan 1, 2007
17.954
-0.24
-1.32%
jan 1, 2008
18.488
+0.534
2.97%
jan 1, 2009
19.481
+0.993
5.37%
jan 1, 2010
17.697
-1.784
-9.16%
jan 1, 2011
19.542
+1.845
10.42%
jan 1, 2012
20.814
+1.273
6.51%
jan 1, 2013
22.073
+1.259
6.05%
Ranking of countries by current statistics by years