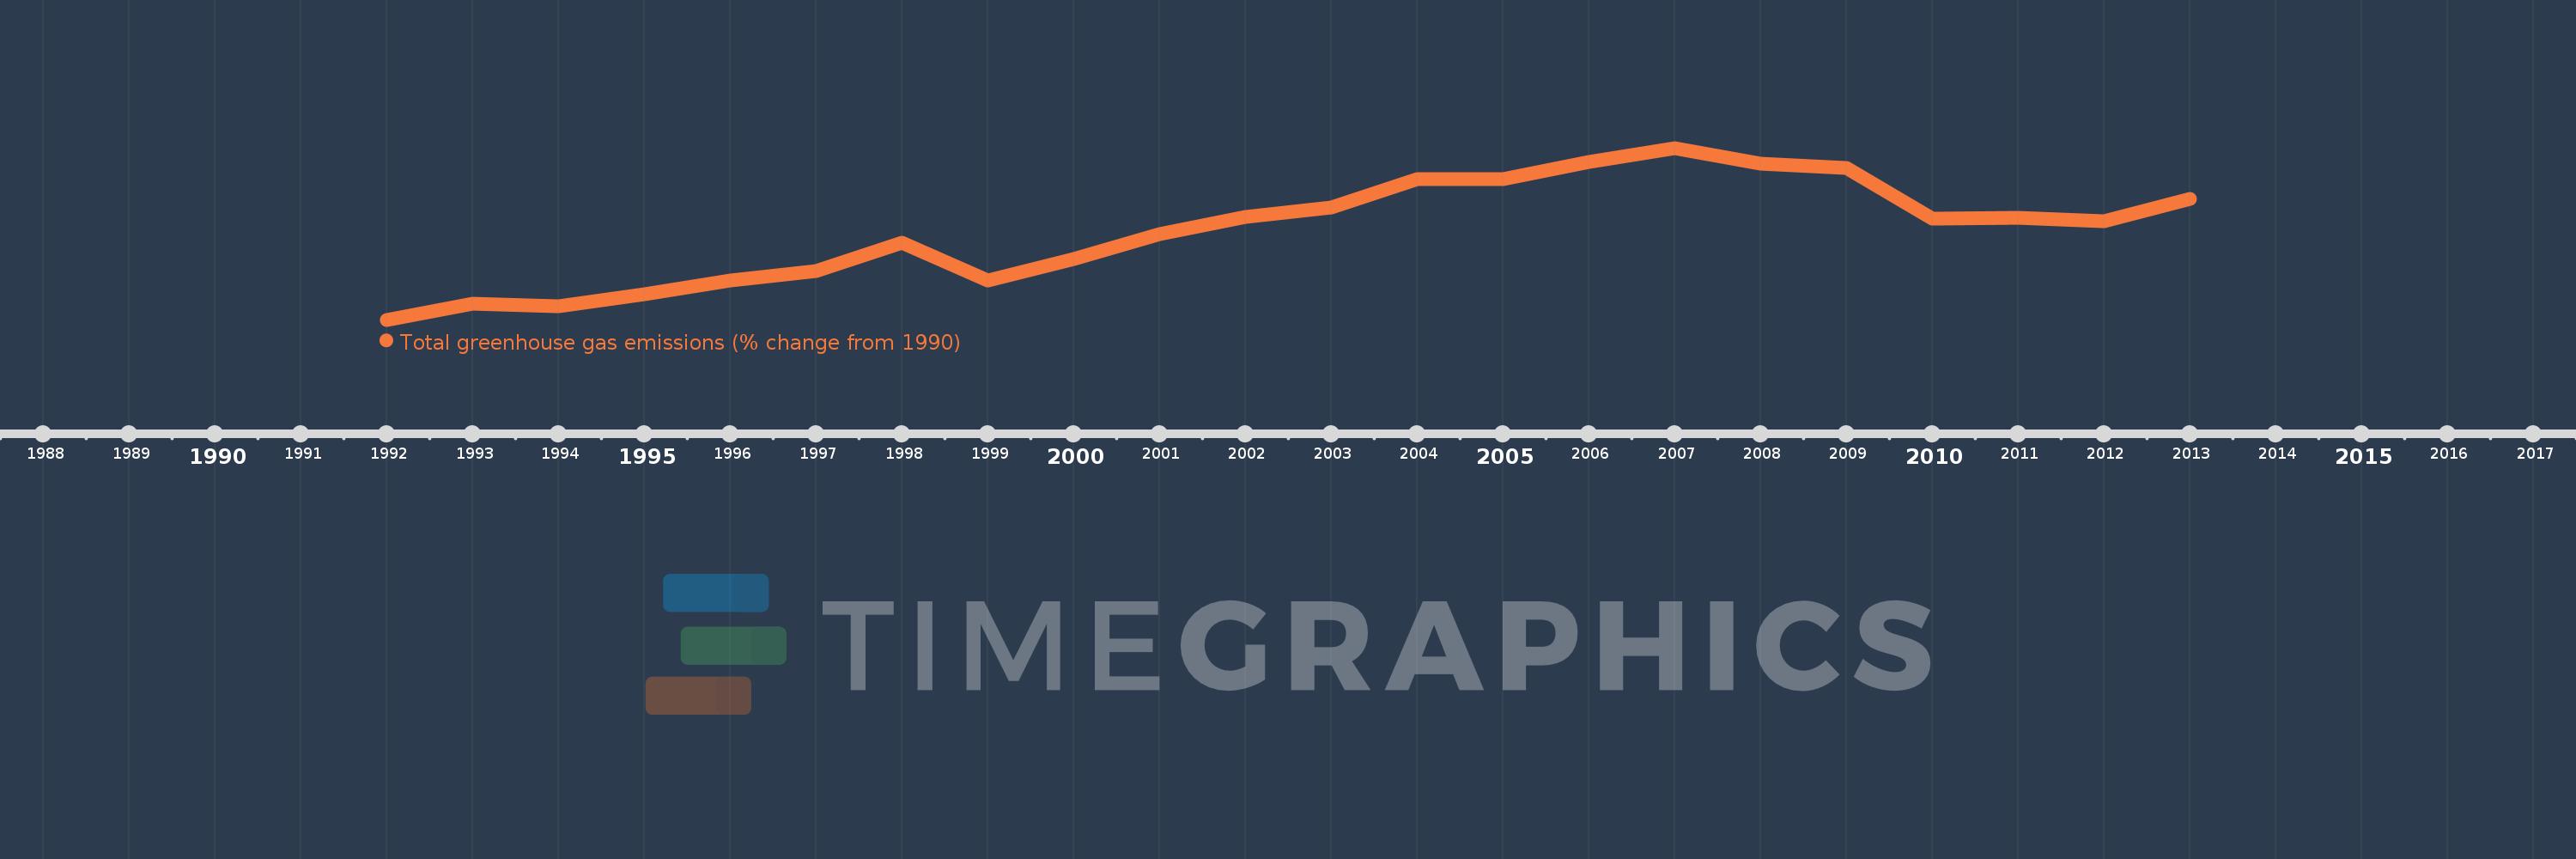
This timeline shows a graph from 1992 to 2013 of New Zealand. No data until 1991. Number of actual observations by date: 22.
Source name:
World Development Indicators
Source organization:
World Bank staff estimates from original source: European Commission, Joint Research Centre (JRC)/Netherlands Environmental Assessment Agency (PBL). Emission Database for Global Atmospheric Research (EDGAR): http://edgar.jrc.ec.europa.eu/.
Categories, topics:
Climate Change, Environment
Last updated:
apr 23, 2017
Indicators value changes by year
Meaning:
13.912
Minimum:
-0.388
jan 1, 1992
Maximum:
27.173
jan 1, 2007
At the date of observation
Value
Absolute change
Change from the previous value
jan 1, 1992
-0.388
-0.388
0.0%
jan 1, 1993
2.223
+2.611
-672.89%
jan 1, 1994
1.835
-0.388
-17.46%
jan 1, 1995
3.658
+1.824
99.4%
jan 1, 1996
5.916
+2.258
61.72%
jan 1, 1997
7.419
+1.503
25.4%
jan 1, 1998
11.963
+4.544
61.25%
jan 1, 1999
5.87
-6.093
-50.93%
jan 1, 2000
9.324
+3.454
58.85%
jan 1, 2001
13.294
+3.97
42.58%
jan 1, 2002
16.117
+2.823
21.23%
jan 1, 2003
17.683
+1.566
9.71%
jan 1, 2004
22.169
+4.486
25.37%
jan 1, 2005
22.133
-0.035
-0.16%
jan 1, 2006
24.93
+2.797
12.64%
jan 1, 2007
27.173
+2.242
8.99%
jan 1, 2008
24.659
-2.513
-9.25%
jan 1, 2009
23.981
-0.678
-2.75%
jan 1, 2010
15.79
-8.191
-34.16%
jan 1, 2011
15.911
+0.121
0.77%
jan 1, 2012
15.469
-0.442
-2.78%
jan 1, 2013
18.939
+3.471
22.44%
Ranking of countries by current statistics by years