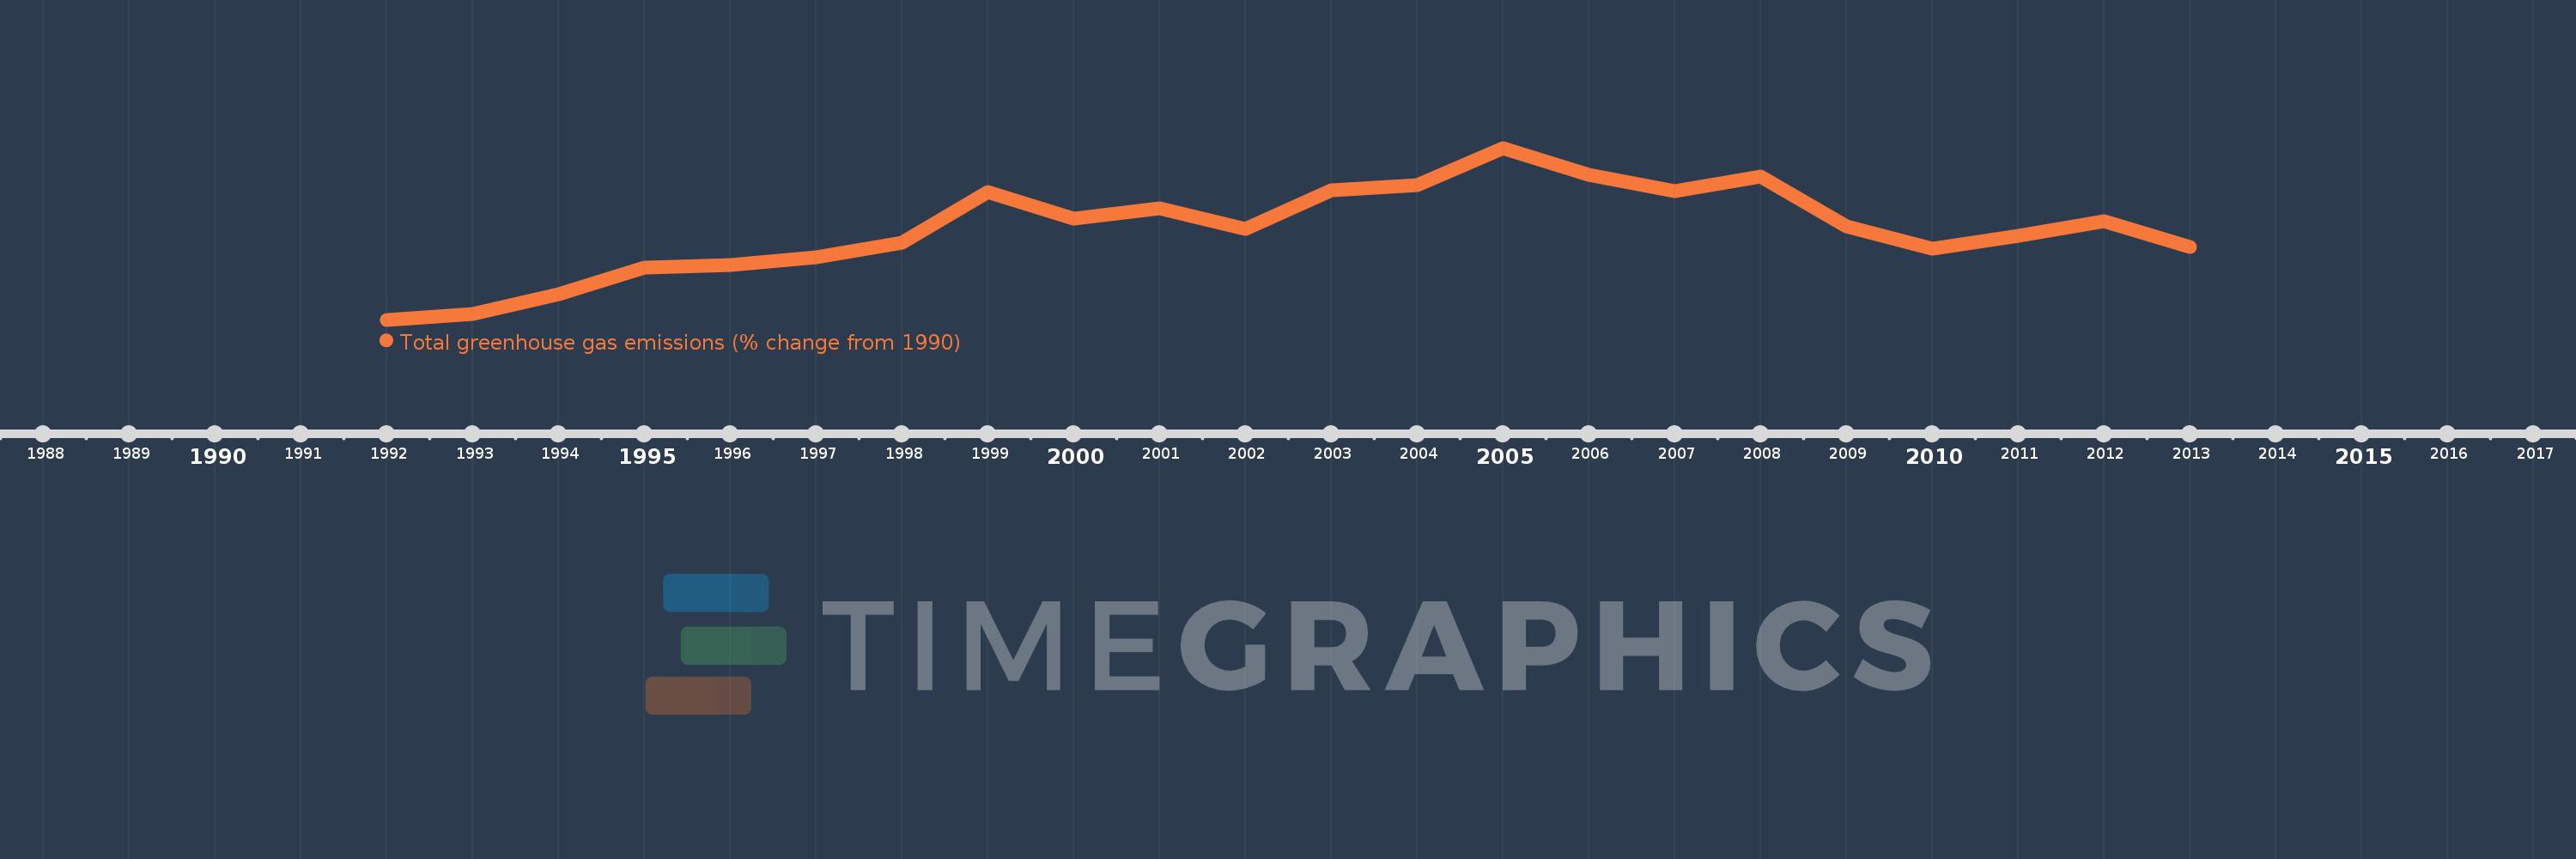
This timeline shows a graph from 1992 to 2013 of North America. No data until 1991. Number of actual observations by date: 22.
Source name:
World Development Indicators
Source organization:
World Bank staff estimates from original source: European Commission, Joint Research Centre (JRC)/Netherlands Environmental Assessment Agency (PBL). Emission Database for Global Atmospheric Research (EDGAR): http://edgar.jrc.ec.europa.eu/.
Categories, topics:
Climate Change, Environment
Last updated:
apr 23, 2017
Indicators value changes by year
Meaning:
11.646
Minimum:
-0.668
jan 1, 1992
Maximum:
22.824
jan 1, 2005
At the date of observation
Value
Absolute change
Change from the previous value
jan 1, 1992
-0.668
-0.668
0.0%
jan 1, 1993
0.166
+0.834
-124.87%
jan 1, 1994
2.866
+2.7
1.63K%
jan 1, 1995
6.482
+3.616
126.17%
jan 1, 1996
6.766
+0.284
4.37%
jan 1, 1997
7.88
+1.114
16.47%
jan 1, 1998
9.919
+2.038
25.87%
jan 1, 1999
16.799
+6.88
69.36%
jan 1, 2000
13.117
-3.682
-21.92%
jan 1, 2001
14.6
+1.483
11.31%
jan 1, 2002
11.784
-2.817
-19.29%
jan 1, 2003
16.983
+5.199
44.12%
jan 1, 2004
17.756
+0.773
4.55%
jan 1, 2005
22.824
+5.068
28.54%
jan 1, 2006
19.091
-3.733
-16.36%
jan 1, 2007
16.962
-2.129
-11.15%
jan 1, 2008
18.91
+1.948
11.48%
jan 1, 2009
12.045
-6.865
-36.3%
jan 1, 2010
9.029
-3.016
-25.04%
jan 1, 2011
10.861
+1.832
20.29%
jan 1, 2012
12.754
+1.893
17.43%
jan 1, 2013
9.282
-3.472
-27.22%
Ranking of countries by current statistics by years