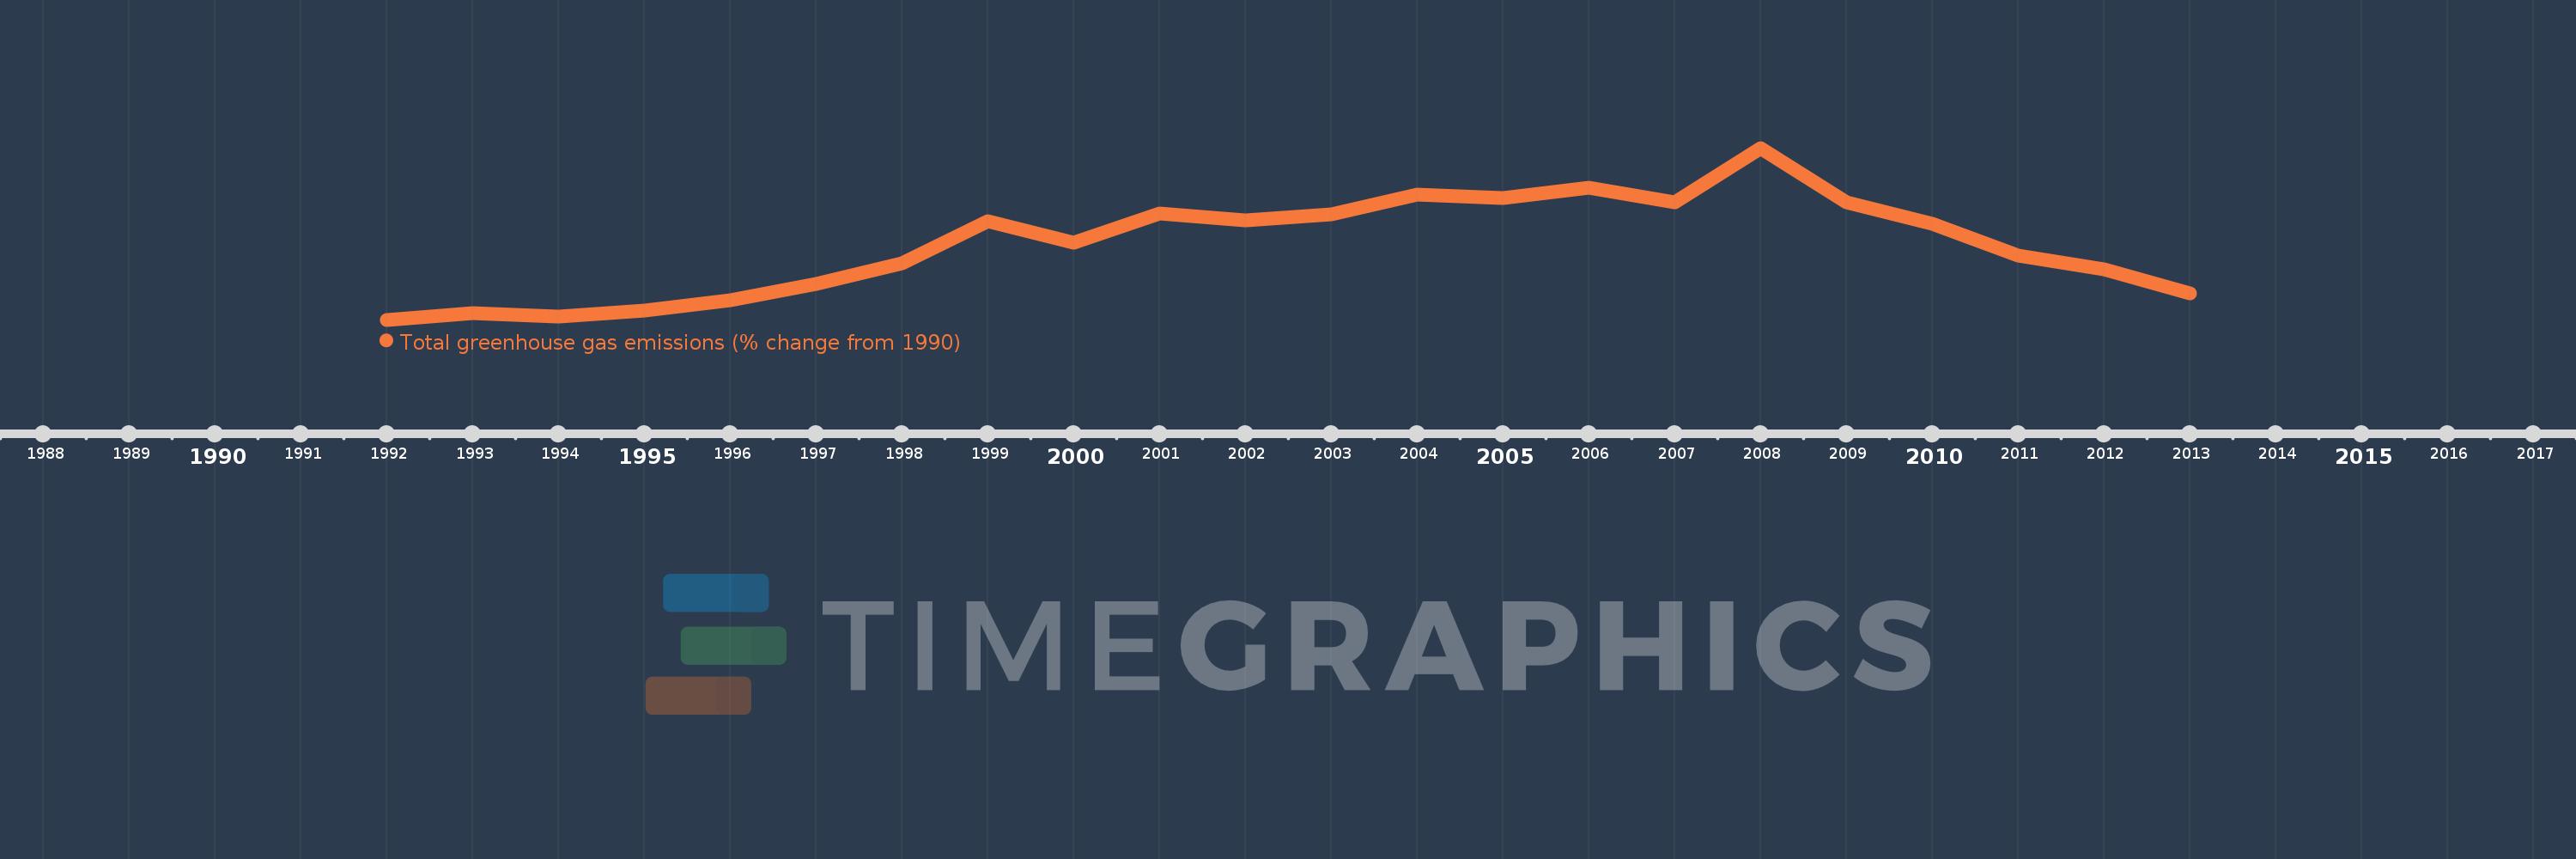
This timeline shows a graph from 1992 to 2013 of Greece. No data until 1991. Number of actual observations by date: 22.
Source name:
World Development Indicators
Source organization:
World Bank staff estimates from original source: European Commission, Joint Research Centre (JRC)/Netherlands Environmental Assessment Agency (PBL). Emission Database for Global Atmospheric Research (EDGAR): http://edgar.jrc.ec.europa.eu/.
Categories, topics:
Climate Change, Environment
Last updated:
apr 23, 2017
Indicators value changes by year
Meaning:
13.222
Minimum:
-1.026
jan 1, 1992
Maximum:
31.795
jan 1, 2008
At the date of observation
Value
Absolute change
Change from the previous value
jan 1, 1992
-1.026
-1.026
0.0%
jan 1, 1993
0.283
+1.309
-127.54%
jan 1, 1994
-0.348
-0.631
-223.27%
jan 1, 1995
0.8
+1.148
-329.55%
jan 1, 1996
2.735
+1.936
242.02%
jan 1, 1997
5.892
+3.157
115.42%
jan 1, 1998
9.837
+3.944
66.94%
jan 1, 1999
17.801
+7.964
80.97%
jan 1, 2000
13.655
-4.146
-23.29%
jan 1, 2001
19.208
+5.553
40.67%
jan 1, 2002
17.961
-1.247
-6.49%
jan 1, 2003
19.145
+1.184
6.59%
jan 1, 2004
22.835
+3.69
19.27%
jan 1, 2005
22.201
-0.634
-2.78%
jan 1, 2006
24.185
+1.985
8.94%
jan 1, 2007
21.368
-2.817
-11.65%
jan 1, 2008
31.795
+10.427
48.8%
jan 1, 2009
21.365
-10.43
-32.8%
jan 1, 2010
17.284
-4.081
-19.1%
jan 1, 2011
11.222
-6.062
-35.07%
jan 1, 2012
8.644
-2.578
-22.97%
jan 1, 2013
4.047
-4.596
-53.18%
Ranking of countries by current statistics by years