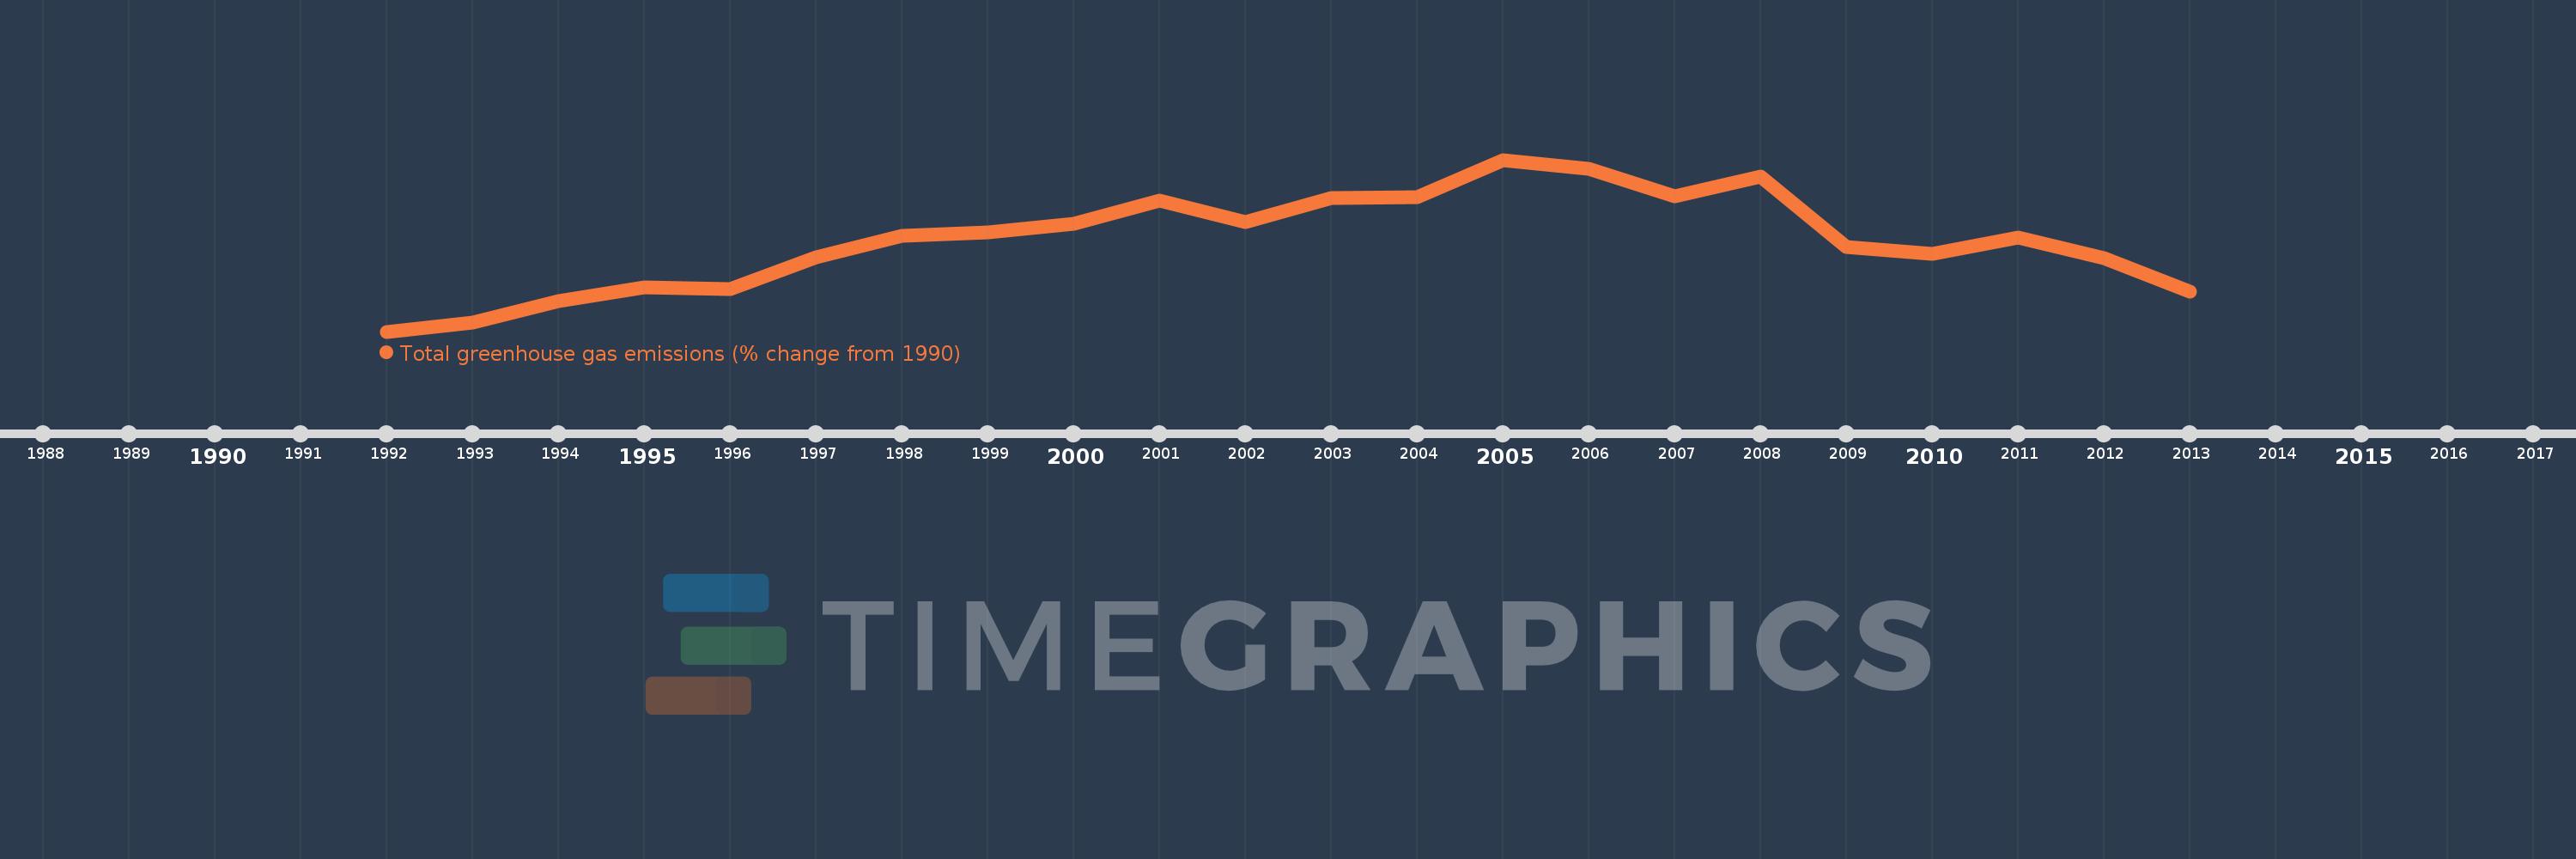
This timeline shows a graph from 1992 to 2013 of United States. No data until 1991. Number of actual observations by date: 22.
Source name:
World Development Indicators
Source organization:
World Bank staff estimates from original source: European Commission, Joint Research Centre (JRC)/Netherlands Environmental Assessment Agency (PBL). Emission Database for Global Atmospheric Research (EDGAR): http://edgar.jrc.ec.europa.eu/.
Categories, topics:
Climate Change, Environment
Last updated:
apr 23, 2017
Indicators value changes by year
Meaning:
9.108
Minimum:
-1.018
jan 1, 1992
Maximum:
18.06
jan 1, 2005
At the date of observation
Value
Absolute change
Change from the previous value
jan 1, 1992
-1.018
-1.018
0.0%
jan 1, 1993
0.023
+1.041
-102.25%
jan 1, 1994
2.389
+2.366
10.34K%
jan 1, 1995
3.893
+1.504
62.94%
jan 1, 1996
3.735
-0.158
-4.05%
jan 1, 1997
7.197
+3.462
92.68%
jan 1, 1998
9.588
+2.391
33.22%
jan 1, 1999
9.989
+0.401
4.18%
jan 1, 2000
10.952
+0.964
9.65%
jan 1, 2001
13.576
+2.624
23.95%
jan 1, 2002
11.166
-2.41
-17.75%
jan 1, 2003
13.782
+2.617
23.43%
jan 1, 2004
13.937
+0.154
1.12%
jan 1, 2005
18.06
+4.123
29.59%
jan 1, 2006
17.058
-1.002
-5.55%
jan 1, 2007
13.983
-3.076
-18.03%
jan 1, 2008
16.181
+2.198
15.72%
jan 1, 2009
8.359
-7.822
-48.34%
jan 1, 2010
7.627
-0.732
-8.76%
jan 1, 2011
9.408
+1.781
23.35%
jan 1, 2012
7.098
-2.309
-24.55%
jan 1, 2013
3.386
-3.713
-52.3%
Ranking of countries by current statistics by years