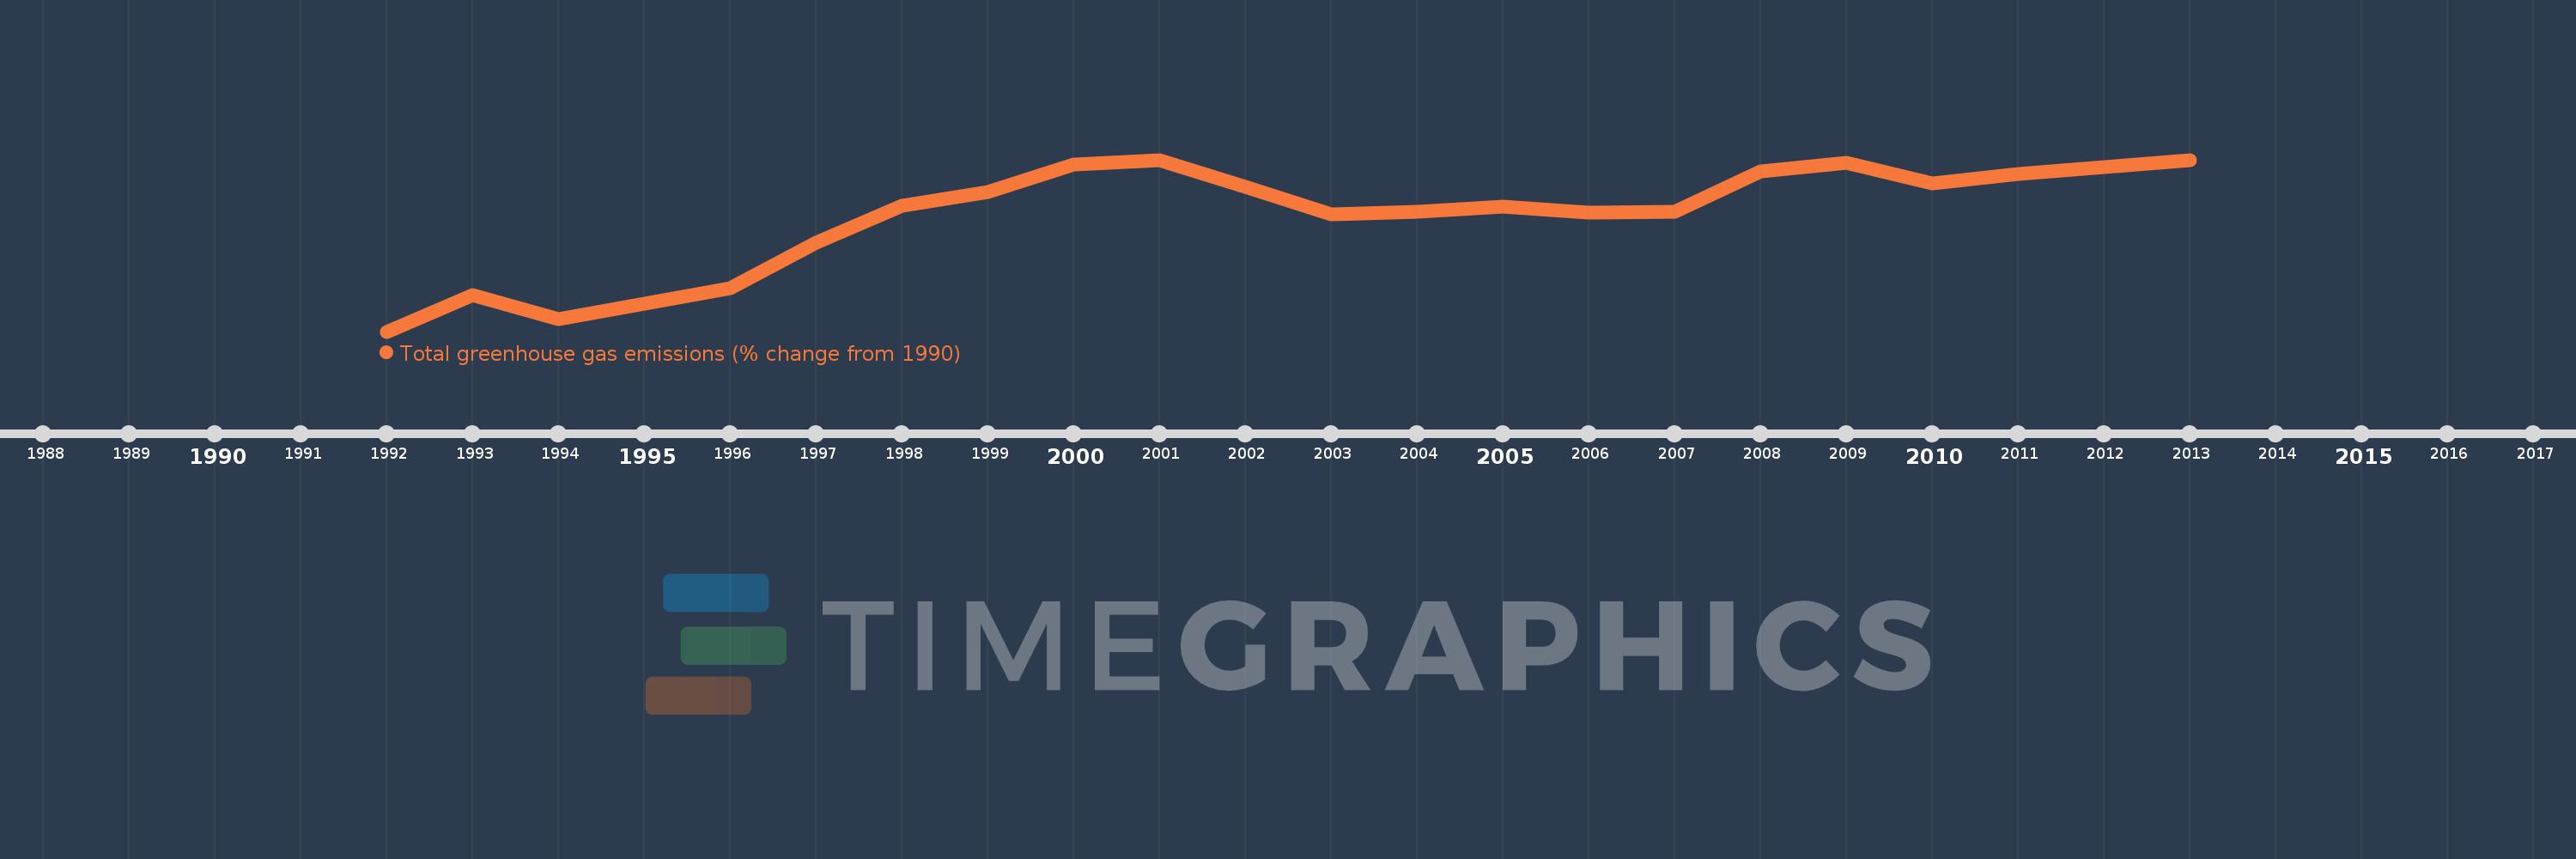
This timeline shows a graph from 1992 to 2013 of Eritrea. No data until 1991. Number of actual observations by date: 22.
Source name:
World Development Indicators
Source organization:
World Bank staff estimates from original source: European Commission, Joint Research Centre (JRC)/Netherlands Environmental Assessment Agency (PBL). Emission Database for Global Atmospheric Research (EDGAR): http://edgar.jrc.ec.europa.eu/.
Categories, topics:
Climate Change, Environment
Last updated:
apr 23, 2017
Indicators value changes by year
Meaning:
33.046
Minimum:
-0.017
jan 1, 1992
Maximum:
49.352
jan 1, 2001
At the date of observation
Value
Absolute change
Change from the previous value
jan 1, 1992
-0.017
-0.017
0.0%
jan 1, 1993
10.593
+10.61
-60.78K%
jan 1, 1994
3.674
-6.918
-65.31%
jan 1, 1995
8.045
+4.371
118.96%
jan 1, 1996
12.475
+4.43
55.07%
jan 1, 1997
25.518
+13.042
104.55%
jan 1, 1998
36.212
+10.695
41.91%
jan 1, 1999
40.04
+3.828
10.57%
jan 1, 2000
48.098
+8.058
20.12%
jan 1, 2001
49.352
+1.255
2.61%
jan 1, 2002
41.684
-7.668
-15.54%
jan 1, 2003
33.62
-8.064
-19.35%
jan 1, 2004
34.375
+0.754
2.24%
jan 1, 2005
35.904
+1.53
4.45%
jan 1, 2006
34.212
-1.693
-4.71%
jan 1, 2007
34.426
+0.214
0.62%
jan 1, 2008
45.982
+11.557
33.57%
jan 1, 2009
48.558
+2.575
5.6%
jan 1, 2010
42.451
-6.106
-12.58%
jan 1, 2011
45.26
+2.809
6.62%
jan 1, 2012
47.302
+2.042
4.51%
jan 1, 2013
49.251
+1.949
4.12%
Ranking of countries by current statistics by years