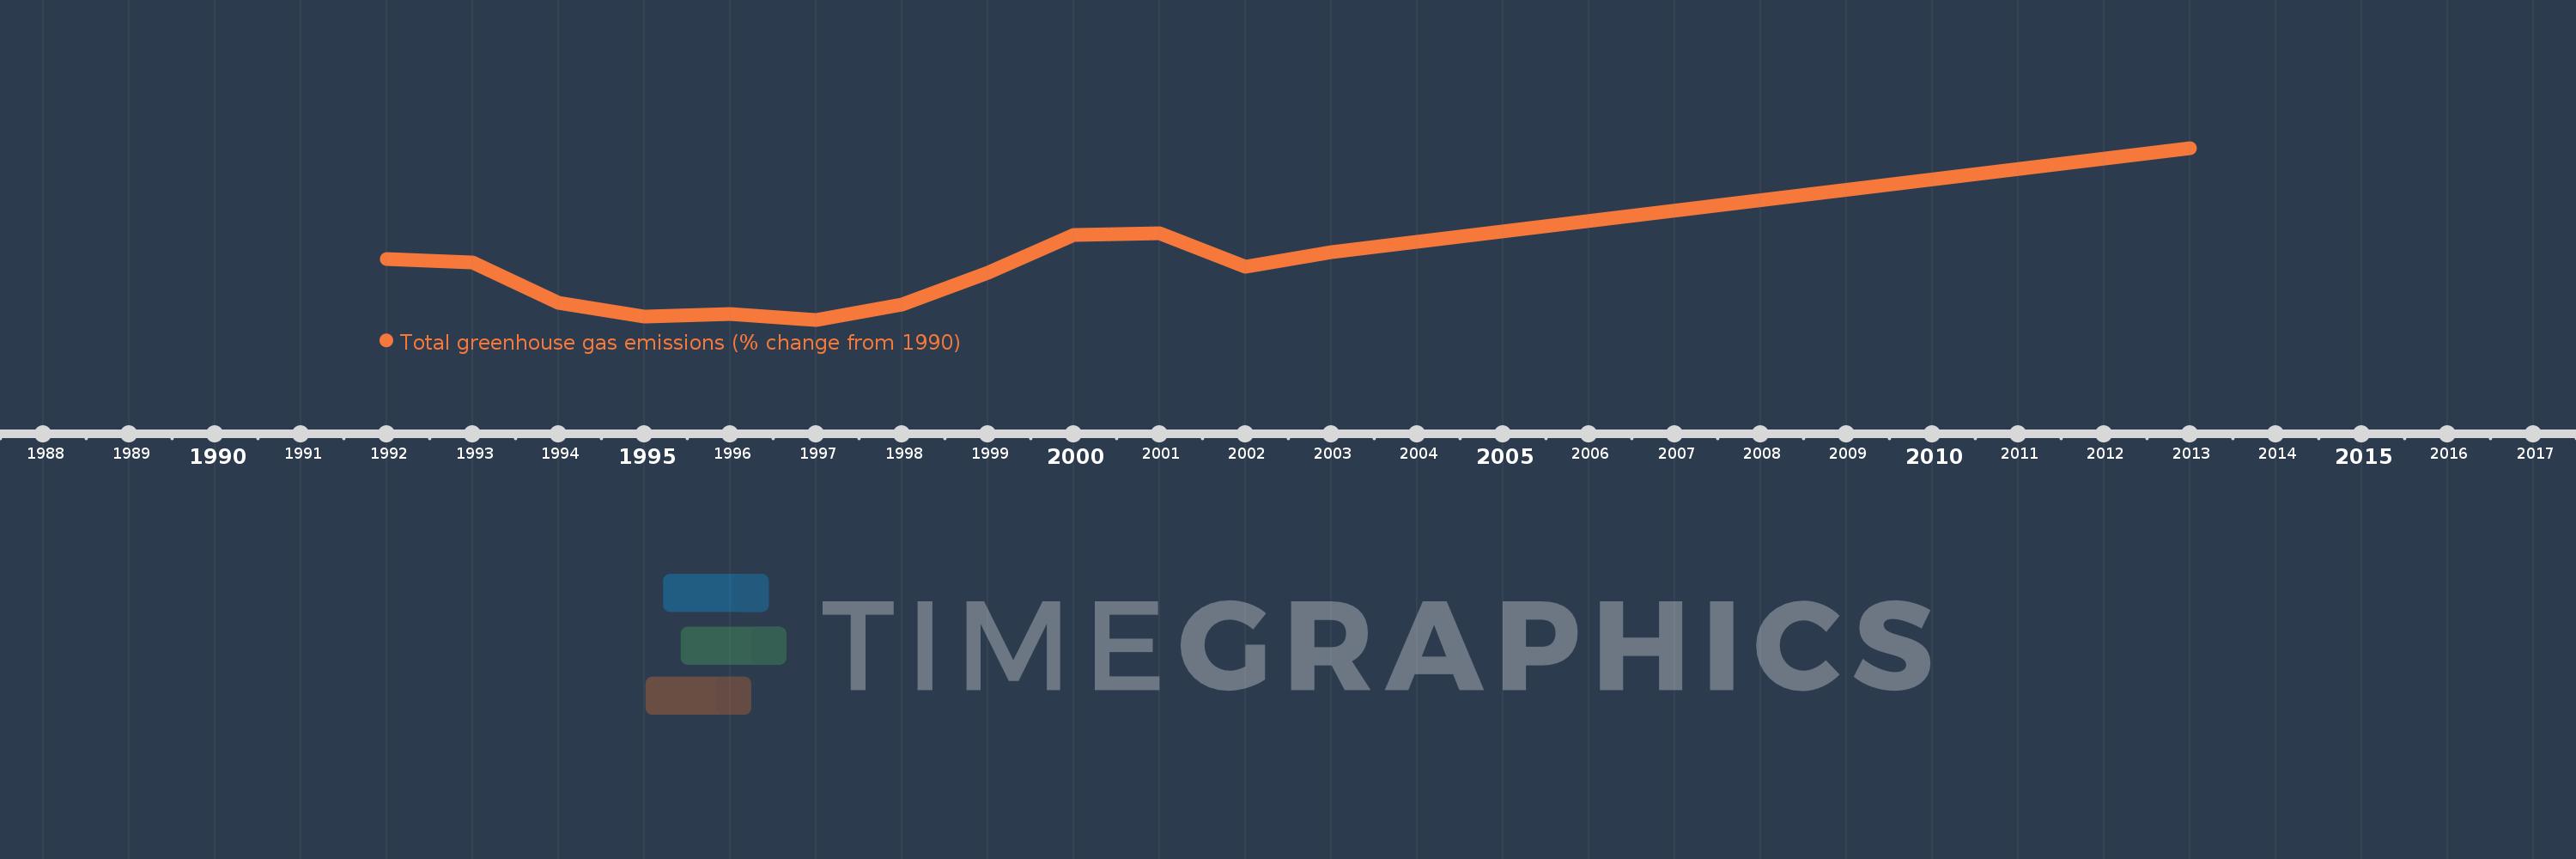
This timeline shows a graph from 1992 to 2013 of Barbados. No data until 1991. Number of actual observations by date: 13.
Source name:
World Development Indicators
Source organization:
World Bank staff estimates from original source: European Commission, Joint Research Centre (JRC)/Netherlands Environmental Assessment Agency (PBL). Emission Database for Global Atmospheric Research (EDGAR): http://edgar.jrc.ec.europa.eu/.
Categories, topics:
Climate Change, Environment
Last updated:
apr 23, 2017
Indicators value changes by year
Meaning:
1.769
Minimum:
-9.671
jan 1, 1997
Maximum:
28.42
jan 1, 2013
At the date of observation
Value
Absolute change
Change from the previous value
jan 1, 1992
3.745
+3.745
0.0%
jan 1, 1993
3.093
-0.652
-17.41%
jan 1, 1994
-5.913
-9.006
-291.19%
jan 1, 1995
-8.895
-2.981
50.41%
jan 1, 1996
-8.345
+0.55
-6.18%
jan 1, 1997
-9.671
-1.326
15.9%
jan 1, 1998
-6.387
+3.284
-33.96%
jan 1, 1999
0.75
+7.137
-111.74%
jan 1, 2000
9.21
+8.46
1.13K%
jan 1, 2001
9.526
+0.316
3.43%
jan 1, 2002
2.121
-7.405
-77.73%
jan 1, 2003
5.341
+3.219
151.75%
jan 1, 2013
28.42
+23.08
432.16%
Ranking of countries by current statistics by years