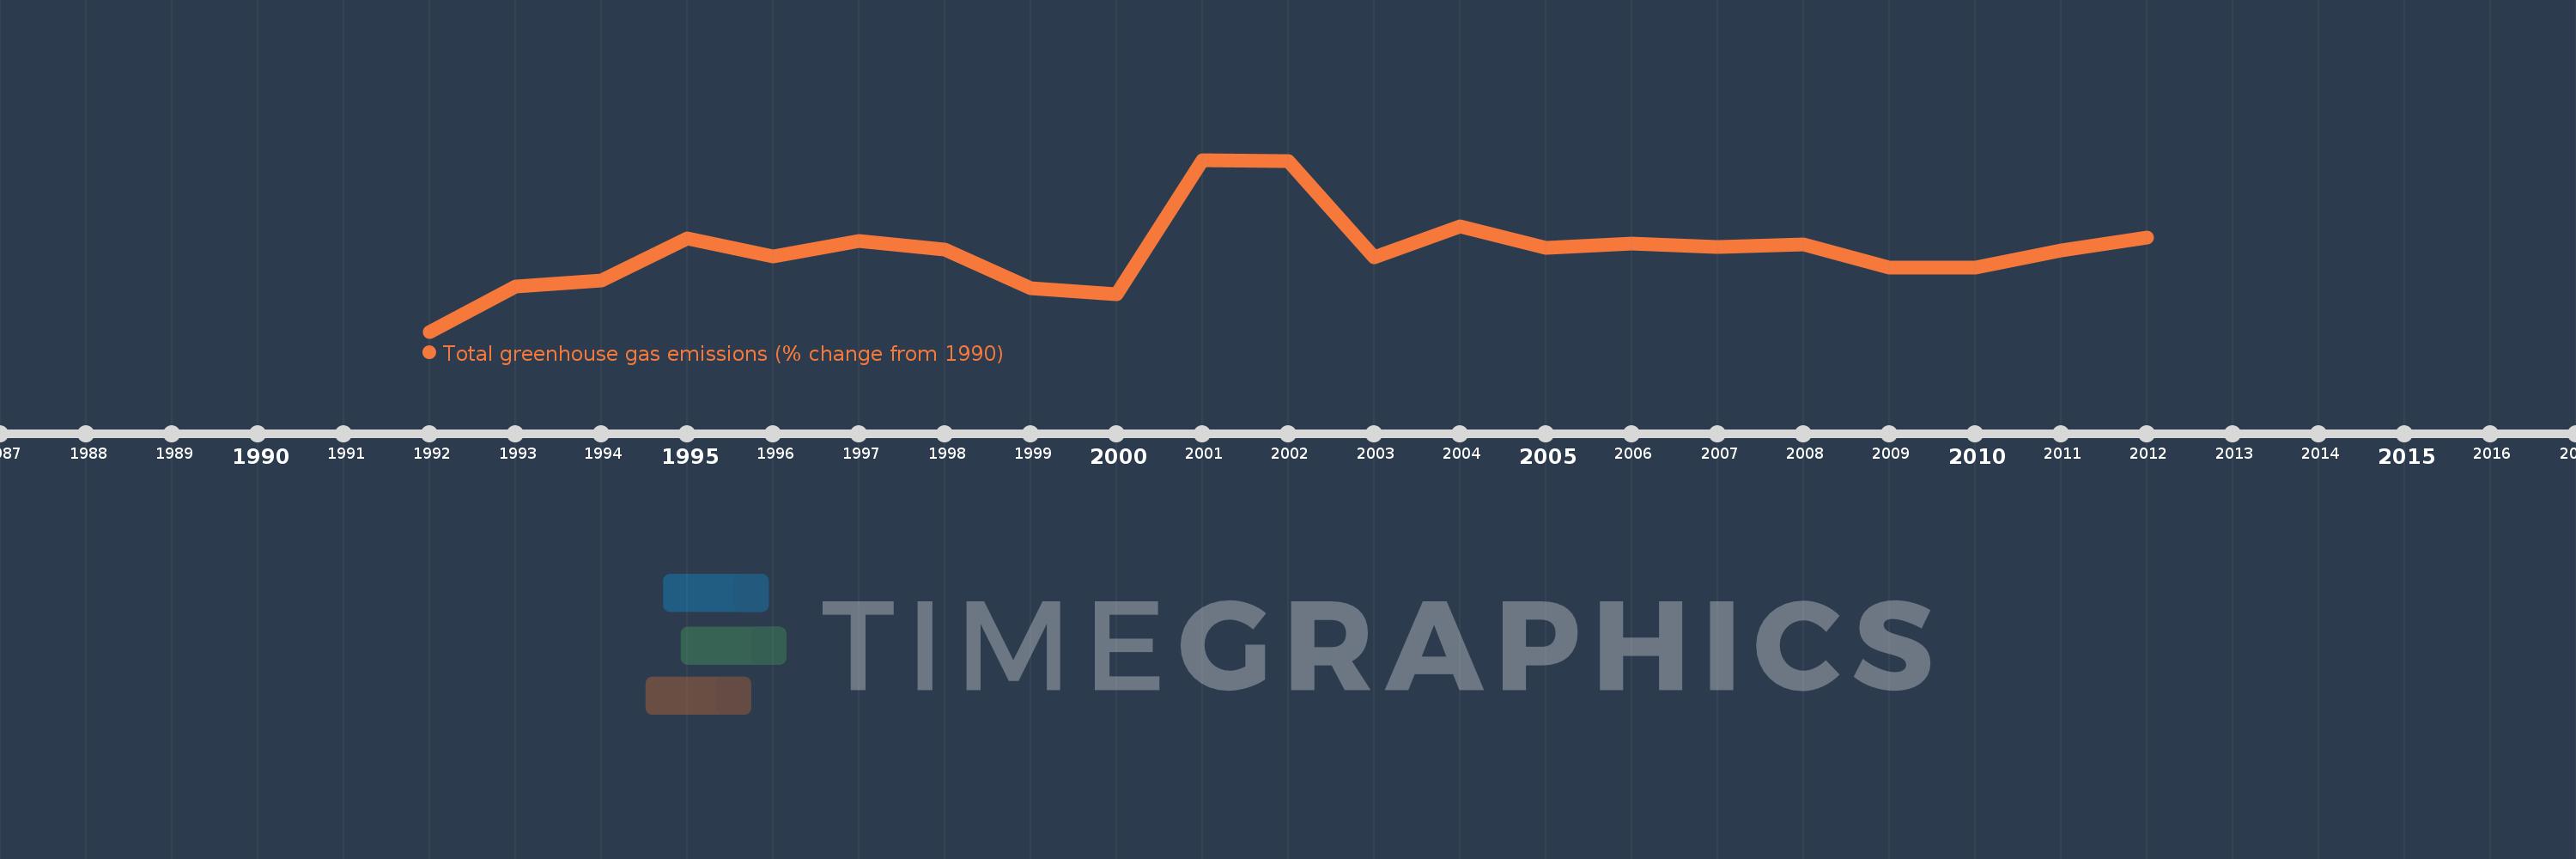
This timeline shows a graph from 1992 to 2012 of Tonga. No data until 1991. Number of actual observations by date: 21.
Source name:
World Development Indicators
Source organization:
World Bank staff estimates from original source: European Commission, Joint Research Centre (JRC)/Netherlands Environmental Assessment Agency (PBL). Emission Database for Global Atmospheric Research (EDGAR): http://edgar.jrc.ec.europa.eu/.
Categories, topics:
Climate Change, Environment
Last updated:
apr 23, 2017
Indicators value changes by year
Meaning:
21.921
Minimum:
5.384
jan 1, 1992
Maximum:
40.715
jan 1, 2001
At the date of observation
Value
Absolute change
Change from the previous value
jan 1, 1992
5.384
+5.384
0.0%
jan 1, 1993
14.659
+9.275
172.26%
jan 1, 1994
15.908
+1.25
8.52%
jan 1, 1995
24.628
+8.72
54.81%
jan 1, 1996
20.892
-3.737
-15.17%
jan 1, 1997
24.039
+3.148
15.07%
jan 1, 1998
22.34
-1.699
-7.07%
jan 1, 1999
14.313
-8.027
-35.93%
jan 1, 2000
13.128
-1.185
-8.28%
jan 1, 2001
40.715
+27.587
210.15%
jan 1, 2002
40.493
-0.222
-0.55%
jan 1, 2003
20.621
-19.871
-49.07%
jan 1, 2004
27.008
+6.387
30.97%
jan 1, 2005
22.53
-4.478
-16.58%
jan 1, 2006
23.577
+1.046
4.64%
jan 1, 2007
22.761
-0.816
-3.46%
jan 1, 2008
23.317
+0.556
2.44%
jan 1, 2009
18.591
-4.726
-20.27%
jan 1, 2010
18.565
-0.026
-0.14%
jan 1, 2011
22.086
+3.521
18.96%
jan 1, 2012
24.782
+2.697
12.21%
Ranking of countries by current statistics by years