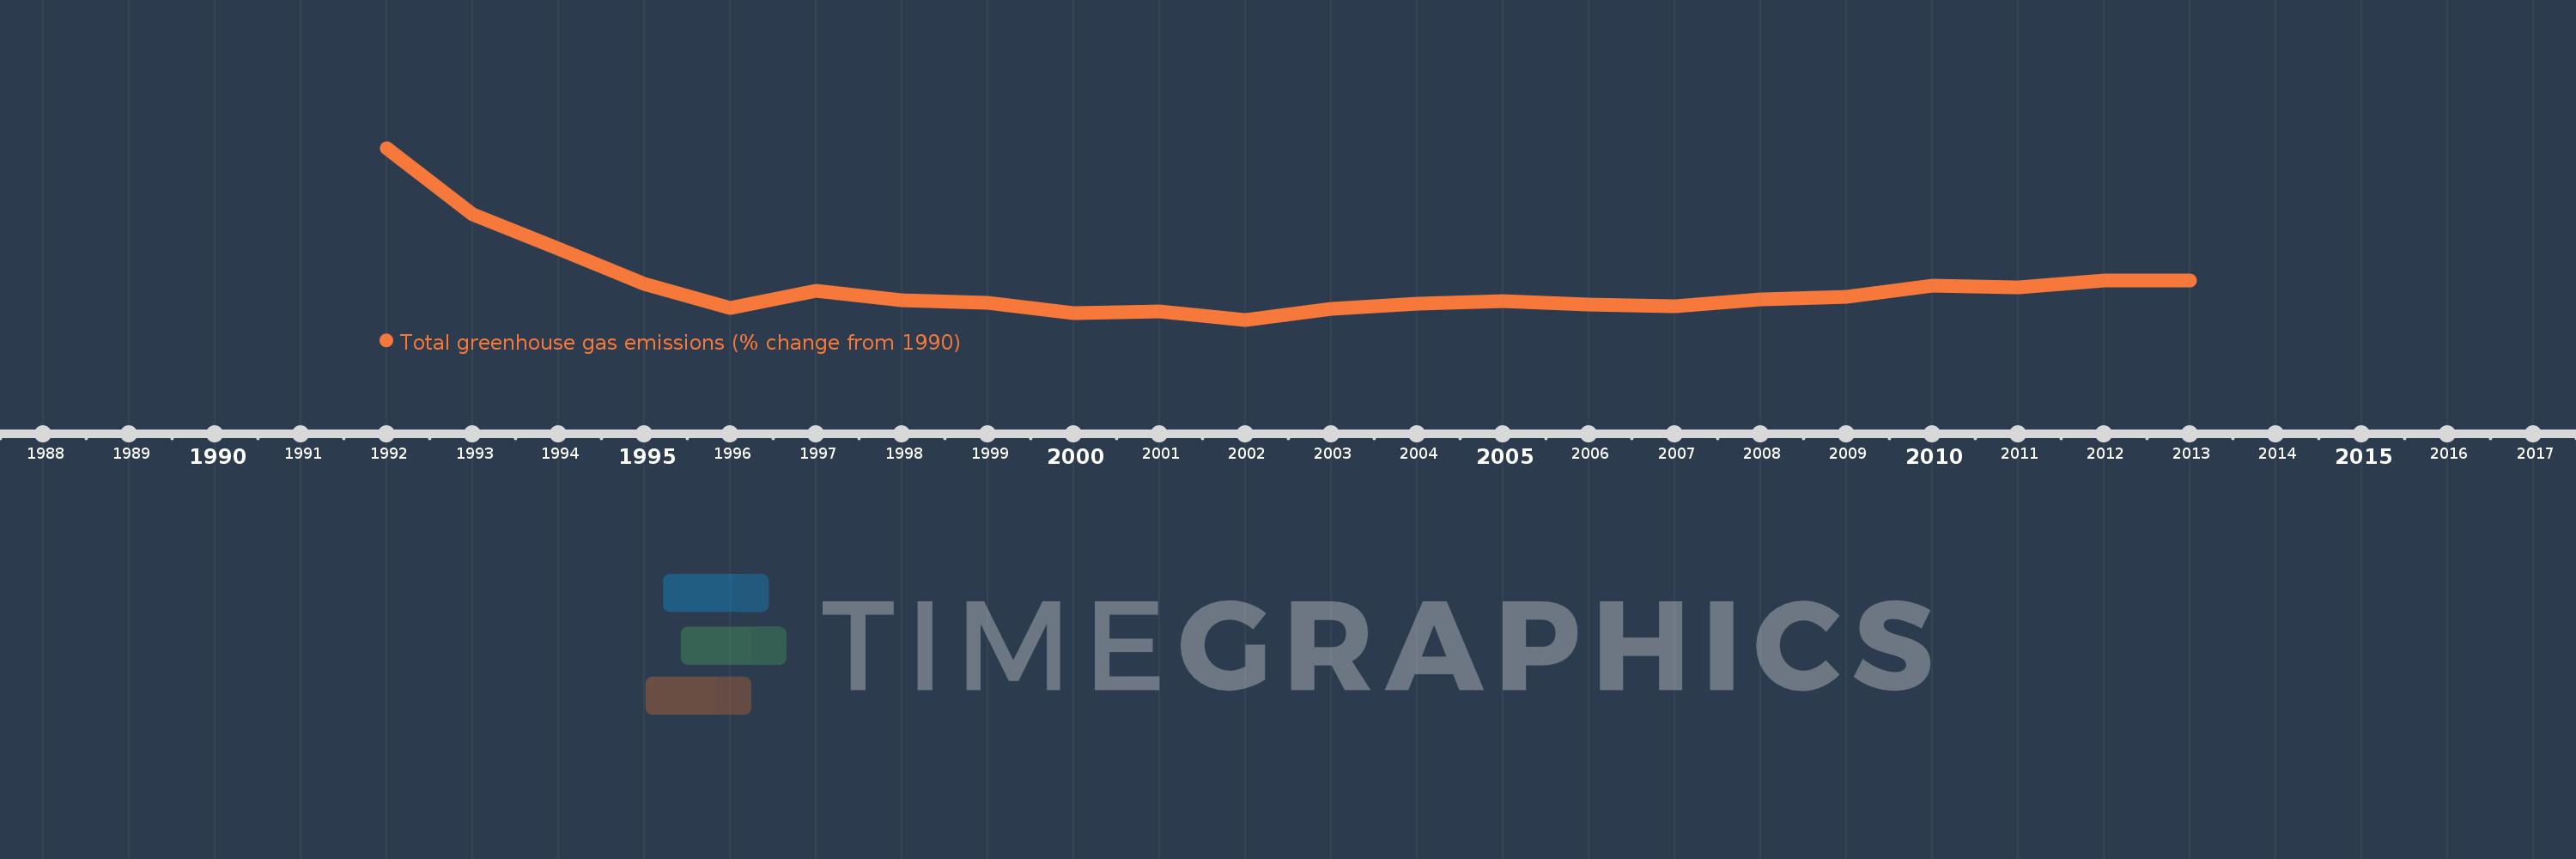
This timeline shows a graph from 1992 to 2013 of Kyrgyz Republic. No data until 1991. Number of actual observations by date: 22.
Source name:
World Development Indicators
Source organization:
World Bank staff estimates from original source: European Commission, Joint Research Centre (JRC)/Netherlands Environmental Assessment Agency (PBL). Emission Database for Global Atmospheric Research (EDGAR): http://edgar.jrc.ec.europa.eu/.
Categories, topics:
Climate Change, Environment
Last updated:
apr 23, 2017
Indicators value changes by year
Meaning:
-60.523
Minimum:
-72.969
jan 1, 2002
Maximum:
-9.314
jan 1, 1992
At the date of observation
Value
Absolute change
Change from the previous value
jan 1, 1992
-9.314
-9.314
0.0%
jan 1, 1993
-33.858
-24.545
263.54%
jan 1, 1994
-46.692
-12.833
37.9%
jan 1, 1995
-59.721
-13.029
27.91%
jan 1, 1996
-68.487
-8.766
14.68%
jan 1, 1997
-62.36
+6.126
-8.95%
jan 1, 1998
-65.695
-3.335
5.35%
jan 1, 1999
-66.59
-0.895
1.36%
jan 1, 2000
-70.435
-3.845
5.77%
jan 1, 2001
-70.033
+0.402
-0.57%
jan 1, 2002
-72.969
-2.936
4.19%
jan 1, 2003
-68.856
+4.113
-5.64%
jan 1, 2004
-66.972
+1.885
-2.74%
jan 1, 2005
-66.218
+0.753
-1.12%
jan 1, 2006
-67.394
-1.175
1.77%
jan 1, 2007
-67.909
-0.515
0.76%
jan 1, 2008
-65.555
+2.354
-3.47%
jan 1, 2009
-64.327
+1.229
-1.87%
jan 1, 2010
-60.284
+4.043
-6.28%
jan 1, 2011
-60.916
-0.632
1.05%
jan 1, 2012
-58.376
+2.539
-4.17%
jan 1, 2013
-58.553
-0.177
0.3%
Ranking of countries by current statistics by years