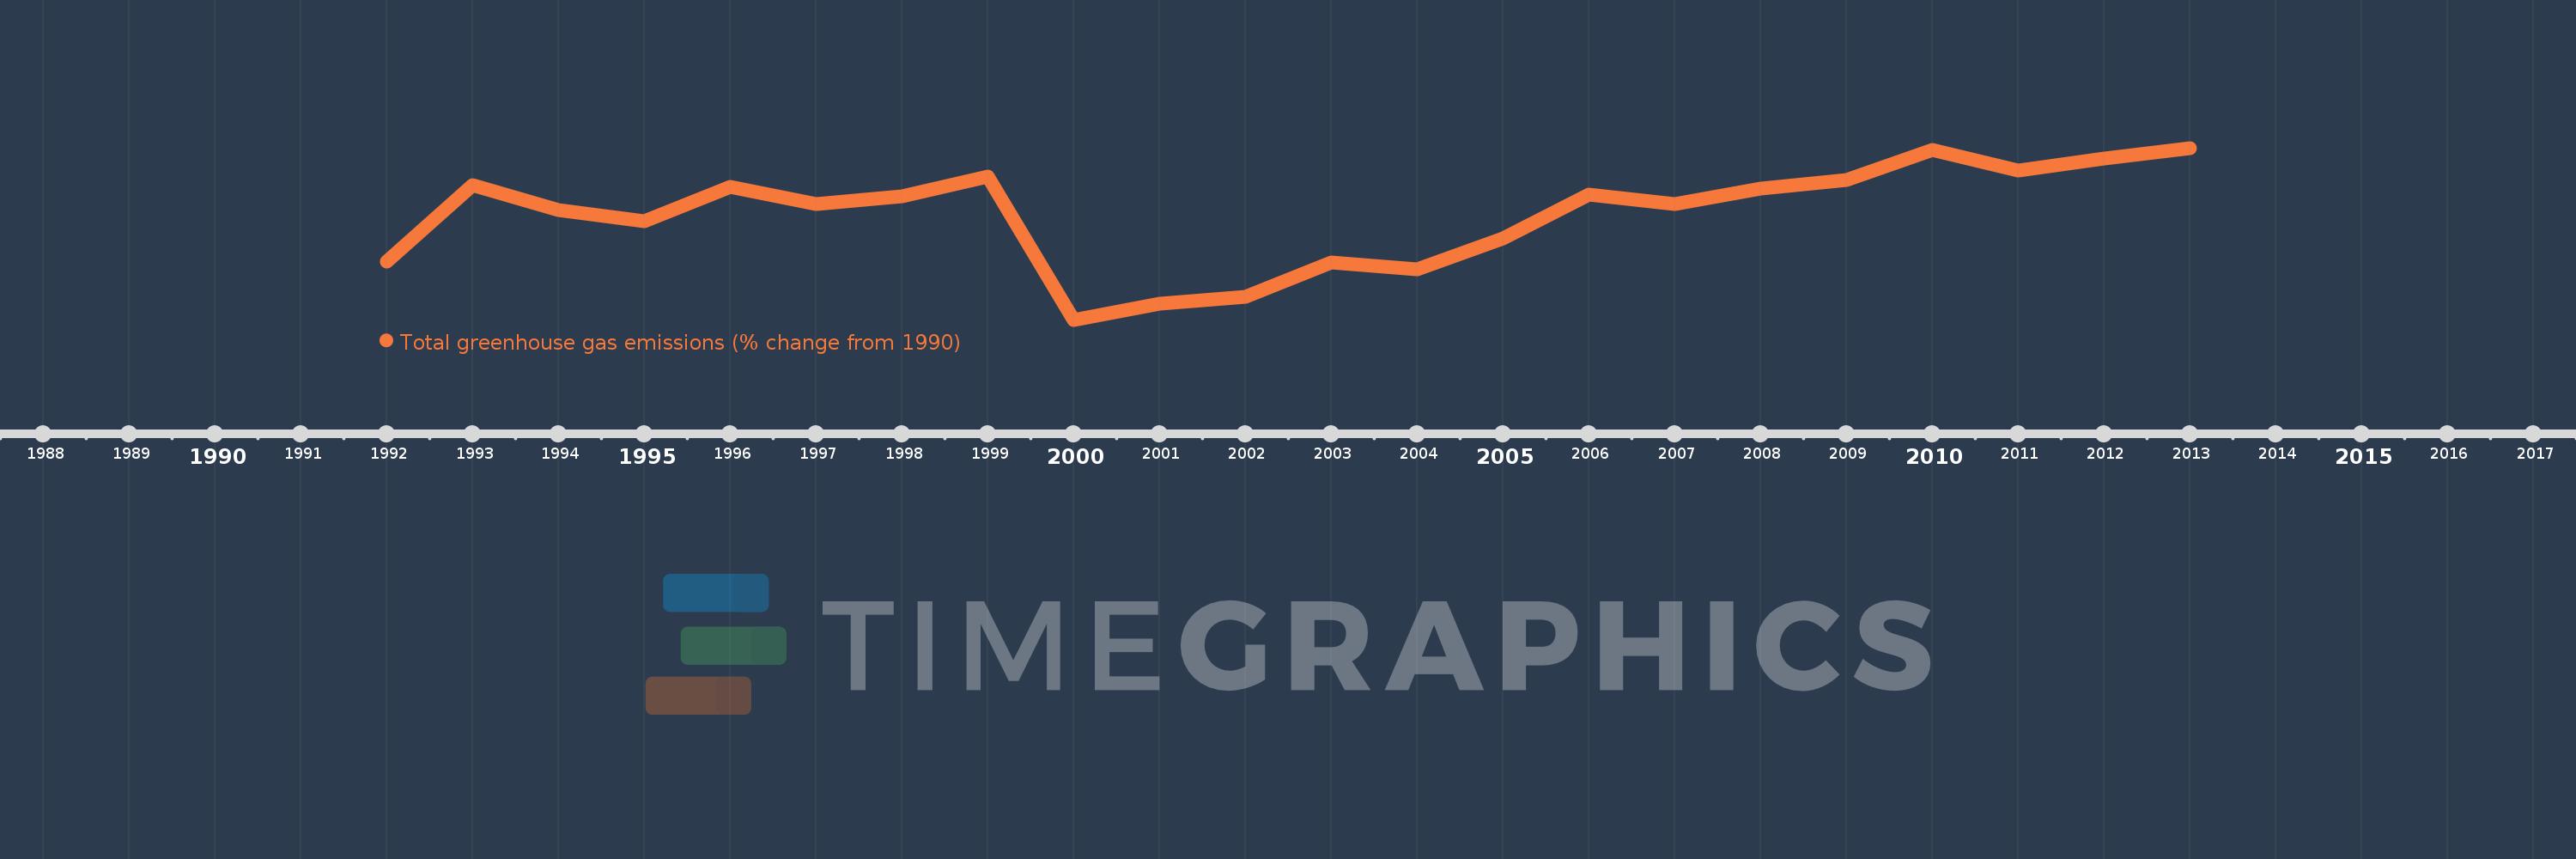
This timeline shows a graph from 1992 to 2013 of Malaysia. No data until 1991. Number of actual observations by date: 22.
Source name:
World Development Indicators
Source organization:
World Bank staff estimates from original source: European Commission, Joint Research Centre (JRC)/Netherlands Environmental Assessment Agency (PBL). Emission Database for Global Atmospheric Research (EDGAR): http://edgar.jrc.ec.europa.eu/.
Categories, topics:
Climate Change, Environment
Last updated:
apr 23, 2017
Indicators value changes by year
Meaning:
17.228
Minimum:
-19.335
jan 1, 2000
Maximum:
40.542
jan 1, 2013
At the date of observation
Value
Absolute change
Change from the previous value
jan 1, 1992
0.838
+0.838
0.0%
jan 1, 1993
27.659
+26.821
3.2K%
jan 1, 1994
18.807
-8.852
-32.0%
jan 1, 1995
14.876
-3.931
-20.9%
jan 1, 1996
26.989
+12.113
81.43%
jan 1, 1997
20.856
-6.133
-22.72%
jan 1, 1998
23.834
+2.978
14.28%
jan 1, 1999
30.492
+6.657
27.93%
jan 1, 2000
-19.335
-49.827
-163.41%
jan 1, 2001
-13.694
+5.641
-29.18%
jan 1, 2002
-11.266
+2.428
-17.73%
jan 1, 2003
0.703
+11.969
-106.24%
jan 1, 2004
-1.612
-2.315
-329.3%
jan 1, 2005
8.911
+10.523
-652.86%
jan 1, 2006
24.21
+15.299
171.68%
jan 1, 2007
21.043
-3.167
-13.08%
jan 1, 2008
26.232
+5.189
24.66%
jan 1, 2009
29.291
+3.059
11.66%
jan 1, 2010
39.978
+10.687
36.49%
jan 1, 2011
32.776
-7.203
-18.02%
jan 1, 2012
36.876
+4.1
12.51%
jan 1, 2013
40.542
+3.666
9.94%
Ranking of countries by current statistics by years