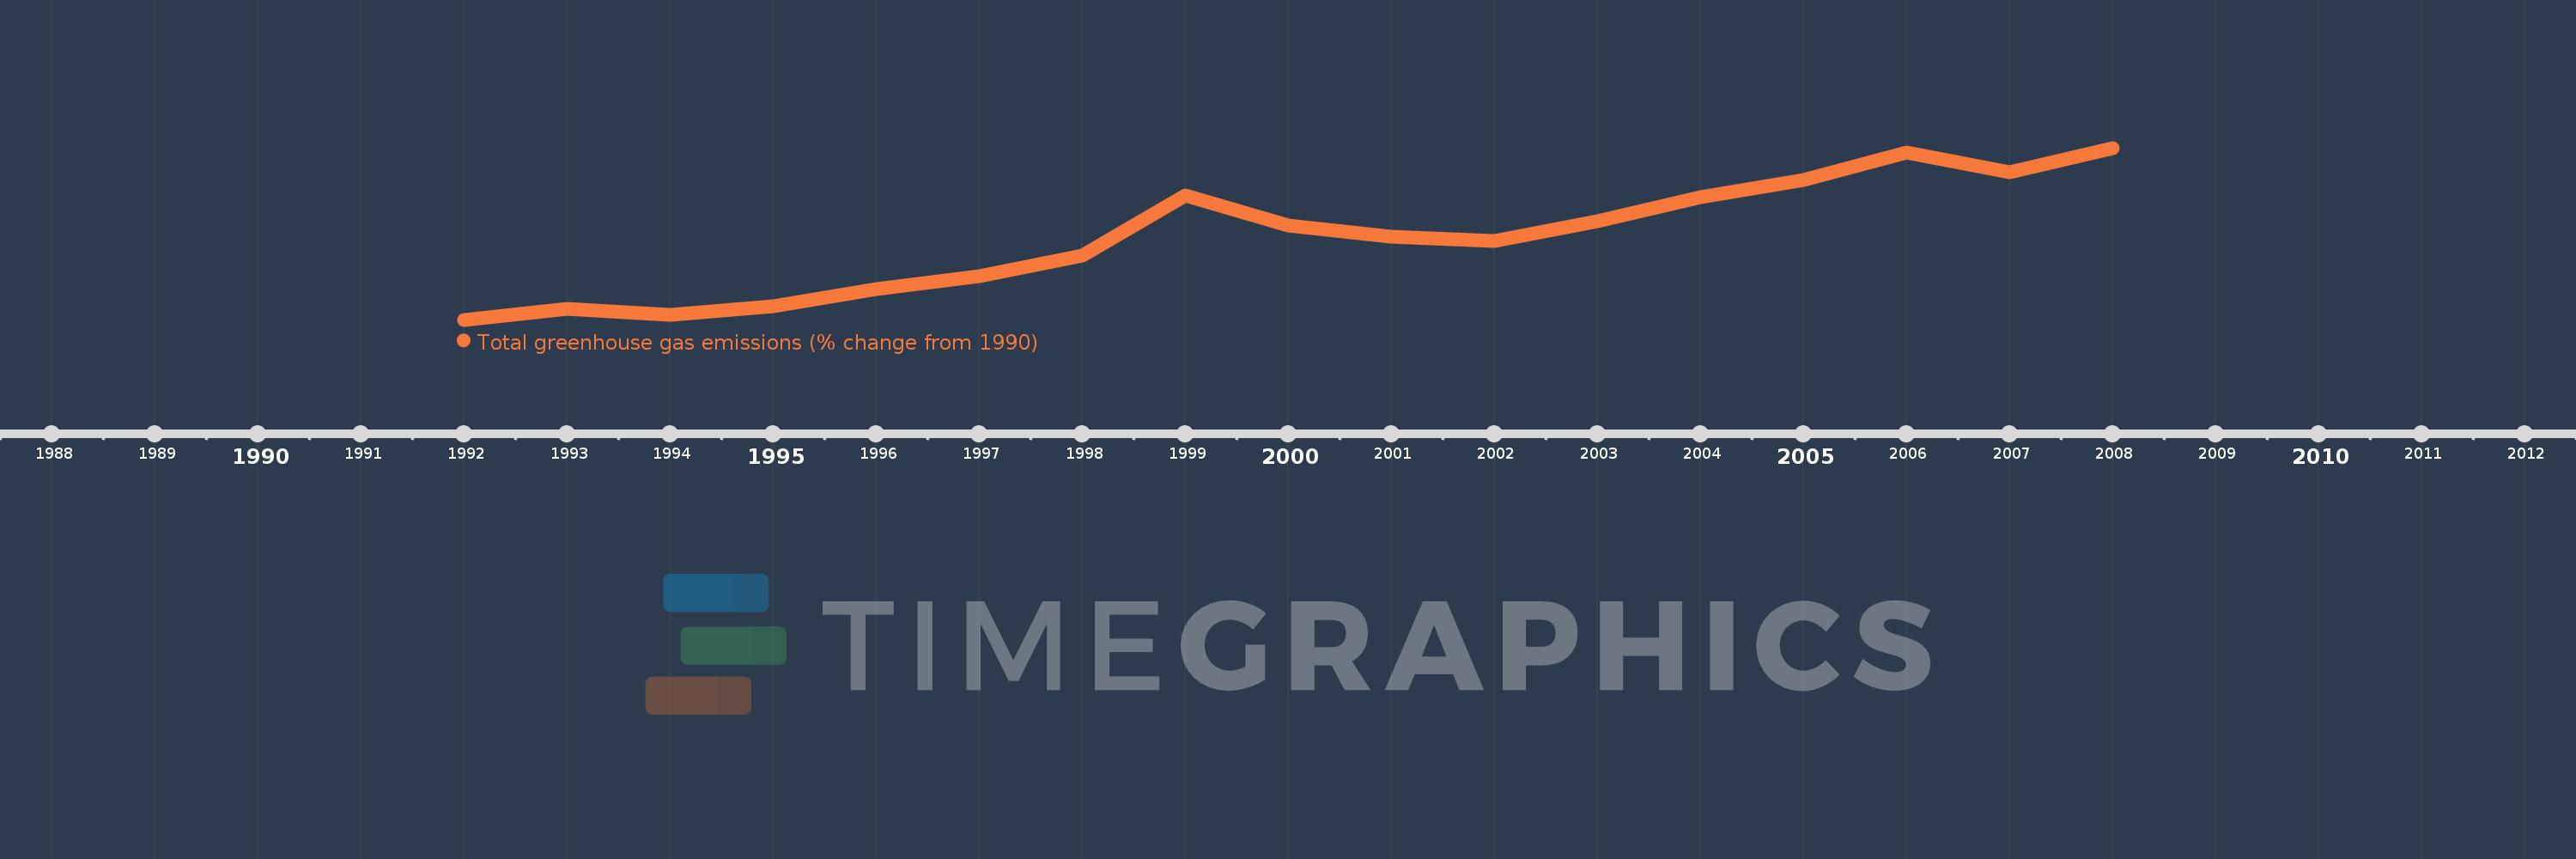
This timeline shows a graph from 1992 to 2008 of South Africa. No data until 1991. Number of actual observations by date: 17.
Source name:
World Development Indicators
Source organization:
World Bank staff estimates from original source: European Commission, Joint Research Centre (JRC)/Netherlands Environmental Assessment Agency (PBL). Emission Database for Global Atmospheric Research (EDGAR): http://edgar.jrc.ec.europa.eu/.
Categories, topics:
Climate Change, Environment
Last updated:
apr 23, 2017
Indicators value changes by year
Meaning:
20.067
Minimum:
-1.664
jan 1, 1992
Maximum:
43.794
jan 1, 2008
At the date of observation
Value
Absolute change
Change from the previous value
jan 1, 1992
-1.664
-1.664
0.0%
jan 1, 1993
1.33
+2.994
-179.93%
jan 1, 1994
-0.39
-1.72
-129.31%
jan 1, 1995
1.853
+2.243
-575.41%
jan 1, 1996
6.343
+4.489
242.24%
jan 1, 1997
9.871
+3.529
55.64%
jan 1, 1998
15.415
+5.543
56.15%
jan 1, 1999
31.126
+15.712
101.93%
jan 1, 2000
23.382
-7.744
-24.88%
jan 1, 2001
20.412
-2.97
-12.7%
jan 1, 2002
19.138
-1.275
-6.25%
jan 1, 2003
24.304
+5.166
26.99%
jan 1, 2004
30.679
+6.375
26.23%
jan 1, 2005
35.37
+4.691
15.29%
jan 1, 2006
42.7
+7.331
20.73%
jan 1, 2007
37.472
-5.229
-12.24%
jan 1, 2008
43.794
+6.322
16.87%
Ranking of countries by current statistics by years