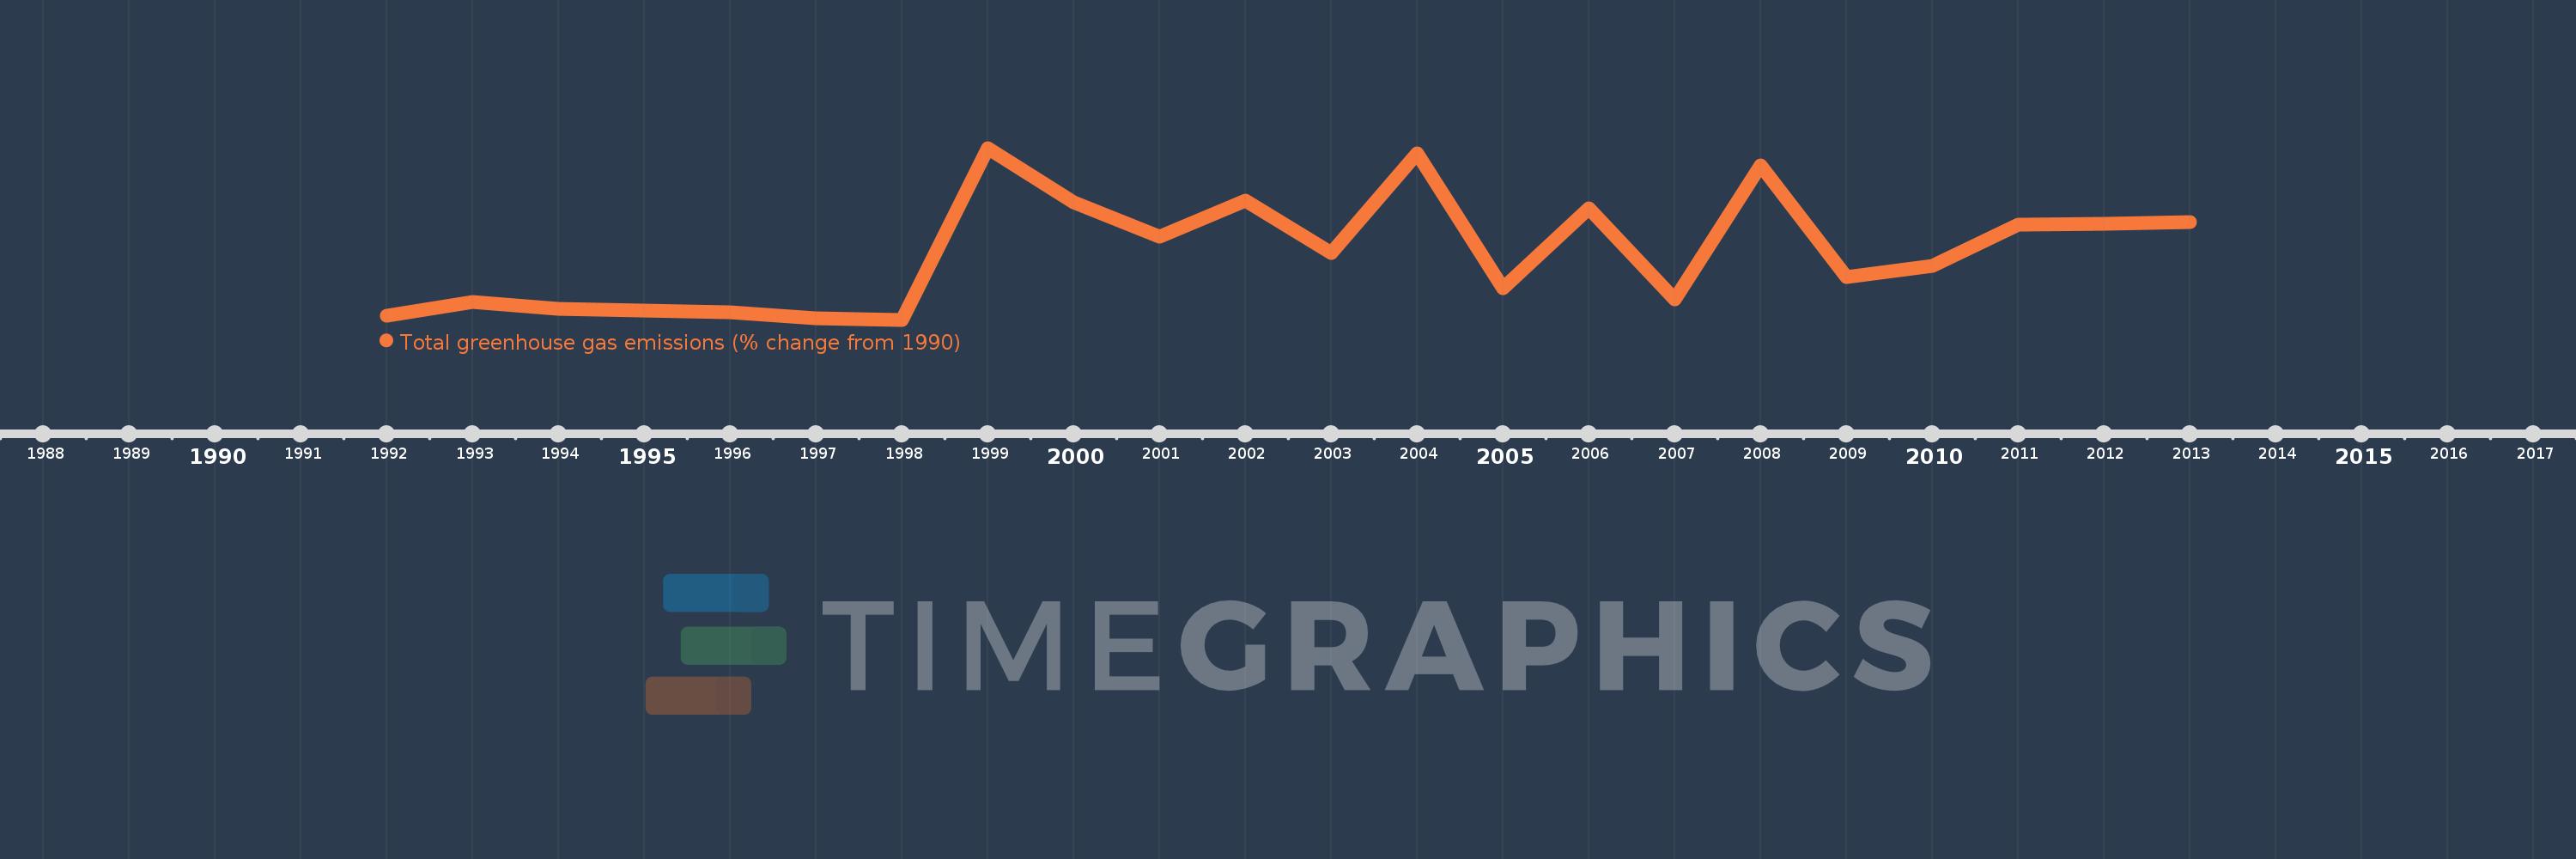
This timeline shows a graph from 1992 to 2013 of Lesotho. No data until 1991. Number of actual observations by date: 22.
Source name:
World Development Indicators
Source organization:
World Bank staff estimates from original source: European Commission, Joint Research Centre (JRC)/Netherlands Environmental Assessment Agency (PBL). Emission Database for Global Atmospheric Research (EDGAR): http://edgar.jrc.ec.europa.eu/.
Categories, topics:
Climate Change, Environment
Last updated:
apr 23, 2017
Indicators value changes by year
Meaning:
56.989
Minimum:
-3.8
jan 1, 1998
Maximum:
151.58
jan 1, 1999
At the date of observation
Value
Absolute change
Change from the previous value
jan 1, 1992
-0.504
-0.504
0.0%
jan 1, 1993
12.018
+12.522
-2.48K%
jan 1, 1994
5.764
-6.254
-52.04%
jan 1, 1995
4.606
-1.158
-20.09%
jan 1, 1996
2.976
-1.63
-35.39%
jan 1, 1997
-2.281
-5.257
-176.65%
jan 1, 1998
-3.8
-1.52
66.62%
jan 1, 1999
151.58
+155.38
-4.09K%
jan 1, 2000
102.771
-48.809
-32.2%
jan 1, 2001
71.618
-31.153
-30.31%
jan 1, 2002
104.221
+32.603
45.52%
jan 1, 2003
56.278
-47.943
-46.0%
jan 1, 2004
147.027
+90.749
161.25%
jan 1, 2005
24.361
-122.666
-83.43%
jan 1, 2006
96.762
+72.401
297.2%
jan 1, 2007
14.815
-81.948
-84.69%
jan 1, 2008
135.835
+121.021
816.89%
jan 1, 2009
35.118
-100.717
-74.15%
jan 1, 2010
44.918
+9.8
27.91%
jan 1, 2011
81.961
+37.043
82.47%
jan 1, 2012
83.243
+1.282
1.56%
jan 1, 2013
84.48
+1.238
1.49%
Ranking of countries by current statistics by years