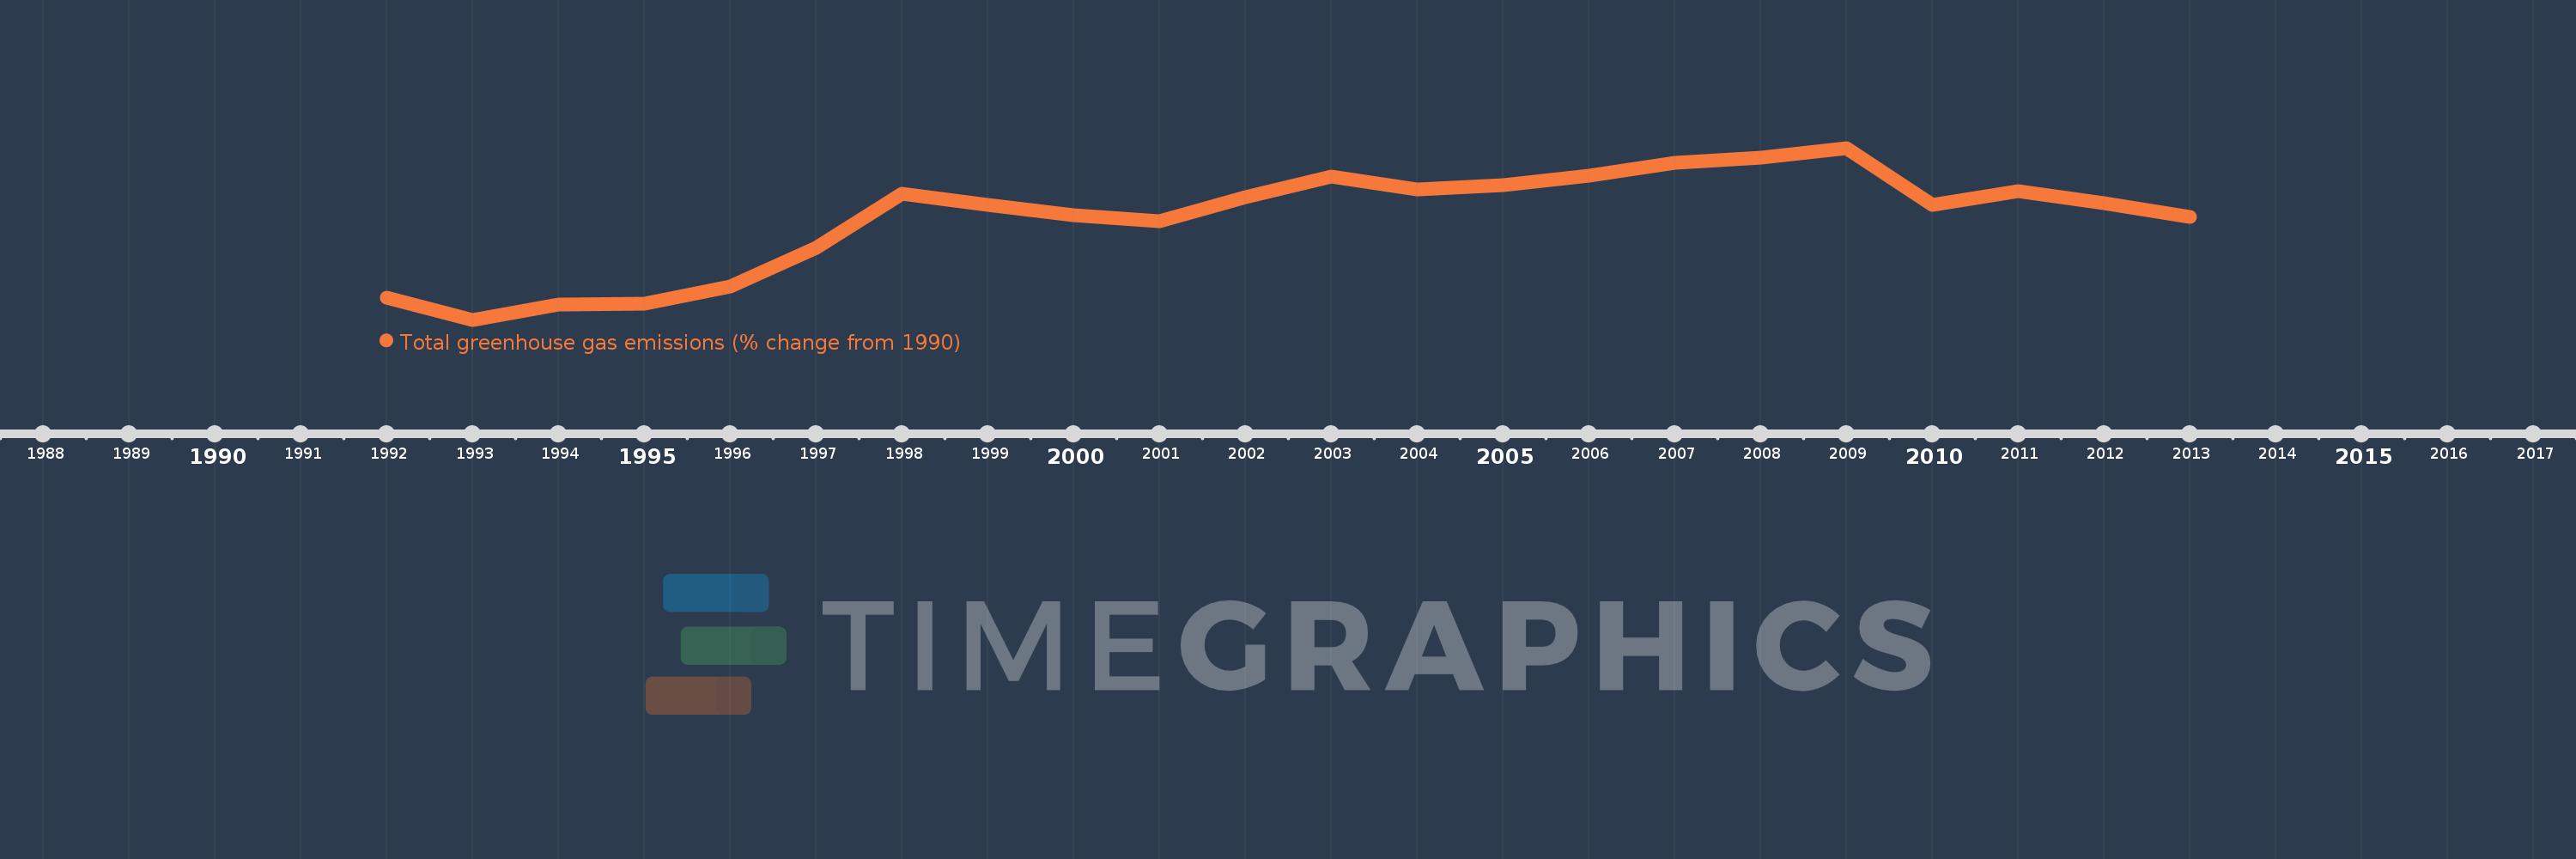
This timeline shows a graph from 1992 to 2013 of Slovenia. No data until 1991. Number of actual observations by date: 22.
Source name:
World Development Indicators
Source organization:
World Bank staff estimates from original source: European Commission, Joint Research Centre (JRC)/Netherlands Environmental Assessment Agency (PBL). Emission Database for Global Atmospheric Research (EDGAR): http://edgar.jrc.ec.europa.eu/.
Categories, topics:
Climate Change, Environment
Last updated:
apr 23, 2017
Indicators value changes by year
Meaning:
5.246
Minimum:
-10.776
jan 1, 1993
Maximum:
16.389
jan 1, 2009
At the date of observation
Value
Absolute change
Change from the previous value
jan 1, 1992
-7.247
-7.247
0.0%
jan 1, 1993
-10.776
-3.529
48.69%
jan 1, 1994
-8.364
+2.412
-22.38%
jan 1, 1995
-8.241
+0.123
-1.47%
jan 1, 1996
-5.548
+2.693
-32.68%
jan 1, 1997
0.551
+6.099
-109.94%
jan 1, 1998
9.112
+8.561
1.55K%
jan 1, 1999
7.399
-1.713
-18.8%
jan 1, 2000
5.778
-1.622
-21.92%
jan 1, 2001
4.751
-1.027
-17.78%
jan 1, 2002
8.591
+3.841
80.85%
jan 1, 2003
11.834
+3.243
37.74%
jan 1, 2004
9.803
-2.031
-17.16%
jan 1, 2005
10.444
+0.641
6.54%
jan 1, 2006
11.957
+1.514
14.49%
jan 1, 2007
14.034
+2.076
17.36%
jan 1, 2008
14.789
+0.755
5.38%
jan 1, 2009
16.389
+1.6
10.82%
jan 1, 2010
7.384
-9.005
-54.95%
jan 1, 2011
9.589
+2.205
29.86%
jan 1, 2012
7.686
-1.903
-19.85%
jan 1, 2013
5.49
-2.196
-28.57%
Ranking of countries by current statistics by years