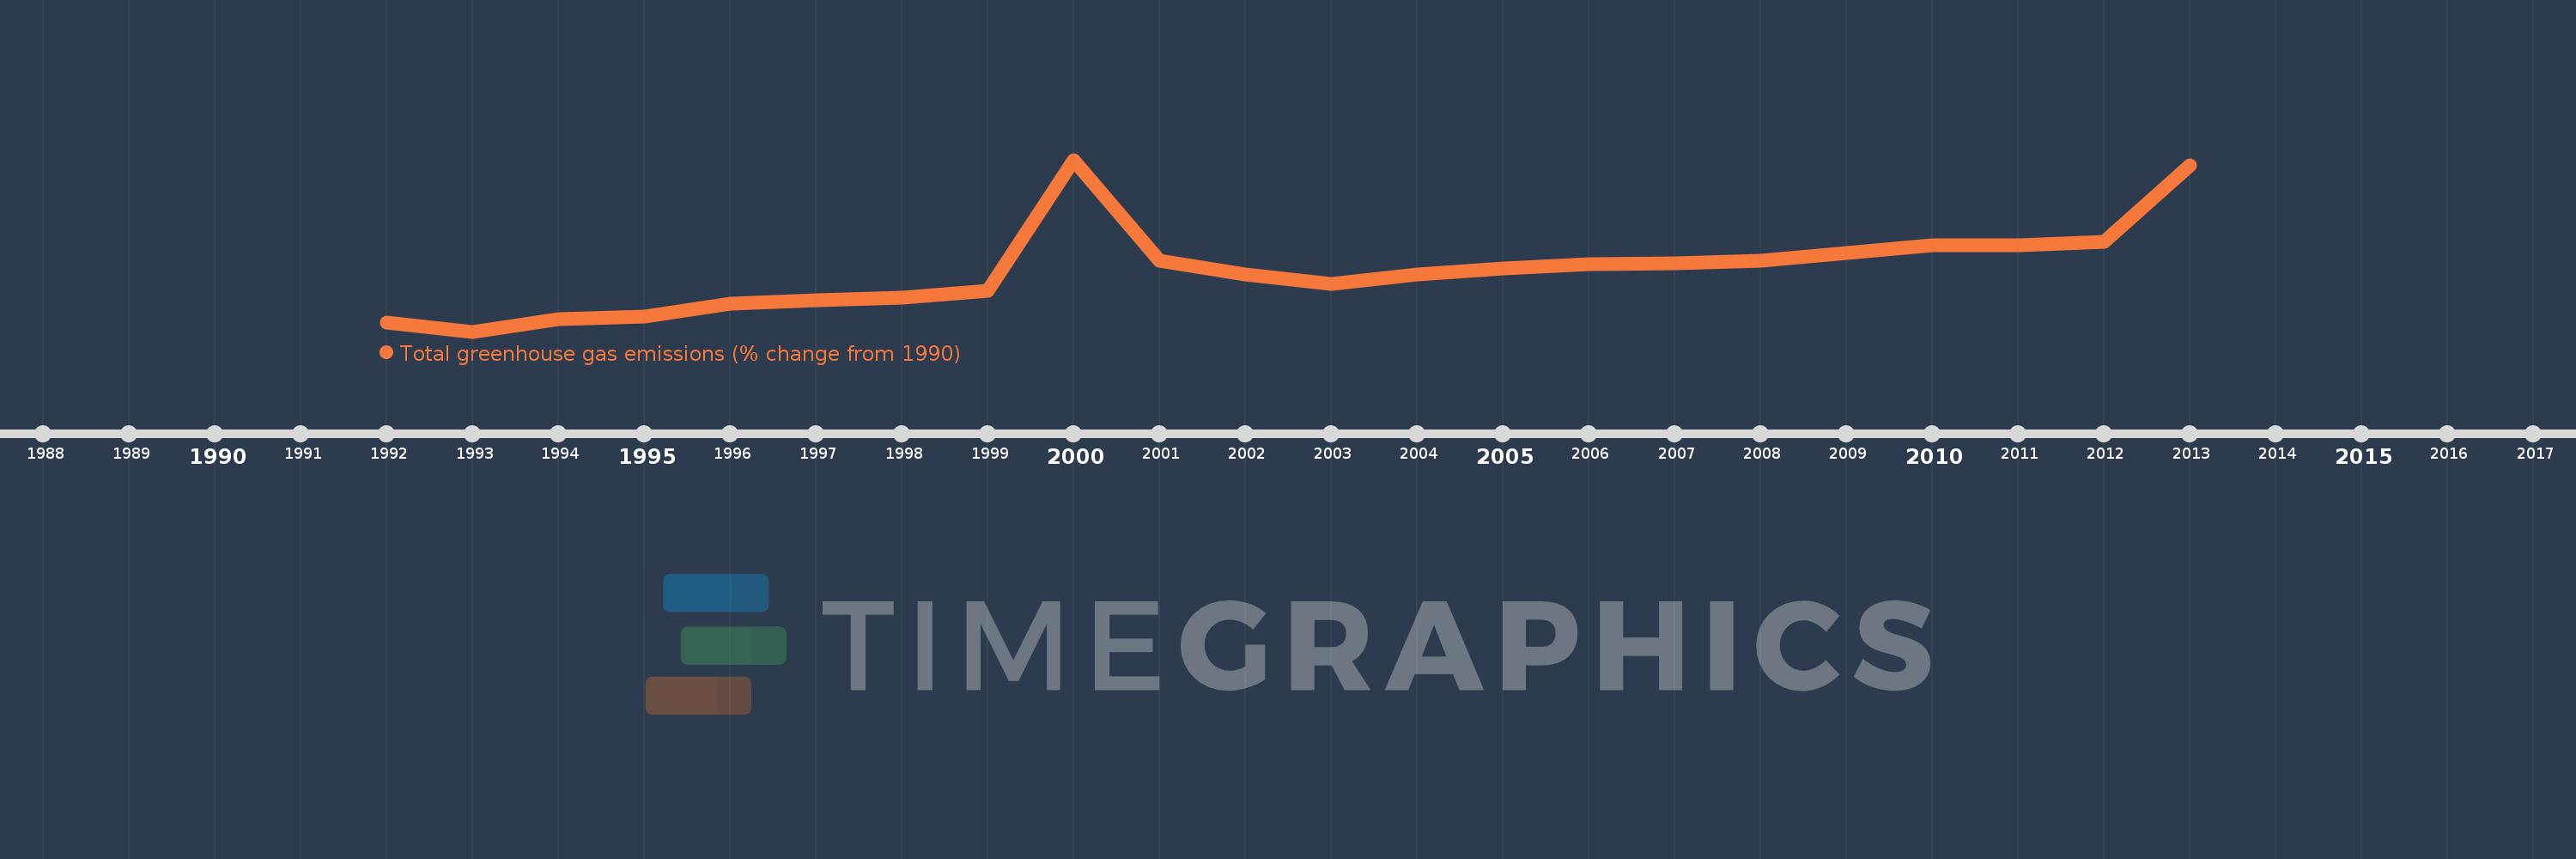
This timeline shows a graph from 1992 to 2013 of Nepal. No data until 1991. Number of actual observations by date: 22.
Source name:
World Development Indicators
Source organization:
World Bank staff estimates from original source: European Commission, Joint Research Centre (JRC)/Netherlands Environmental Assessment Agency (PBL). Emission Database for Global Atmospheric Research (EDGAR): http://edgar.jrc.ec.europa.eu/.
Categories, topics:
Climate Change, Environment
Last updated:
apr 23, 2017
Indicators value changes by year
Meaning:
20.566
Minimum:
-3.929
jan 1, 1993
Maximum:
64.551
jan 1, 2000
At the date of observation
Value
Absolute change
Change from the previous value
jan 1, 1992
-0.403
-0.403
0.0%
jan 1, 1993
-3.929
-3.525
873.96%
jan 1, 1994
1.016
+4.945
-125.85%
jan 1, 1995
2.092
+1.076
105.95%
jan 1, 1996
7.114
+5.022
240.08%
jan 1, 1997
8.44
+1.325
18.63%
jan 1, 1998
9.747
+1.307
15.49%
jan 1, 1999
12.296
+2.549
26.15%
jan 1, 2000
64.551
+52.255
424.97%
jan 1, 2001
24.347
-40.204
-62.28%
jan 1, 2002
18.813
-5.535
-22.73%
jan 1, 2003
15.117
-3.696
-19.65%
jan 1, 2004
18.826
+3.709
24.53%
jan 1, 2005
21.138
+2.312
12.28%
jan 1, 2006
22.868
+1.73
8.19%
jan 1, 2007
23.201
+0.333
1.46%
jan 1, 2008
24.465
+1.264
5.45%
jan 1, 2009
27.503
+3.037
12.42%
jan 1, 2010
30.619
+3.116
11.33%
jan 1, 2011
30.338
-0.281
-0.92%
jan 1, 2012
32.019
+1.681
5.54%
jan 1, 2013
62.283
+30.264
94.52%
Ranking of countries by current statistics by years