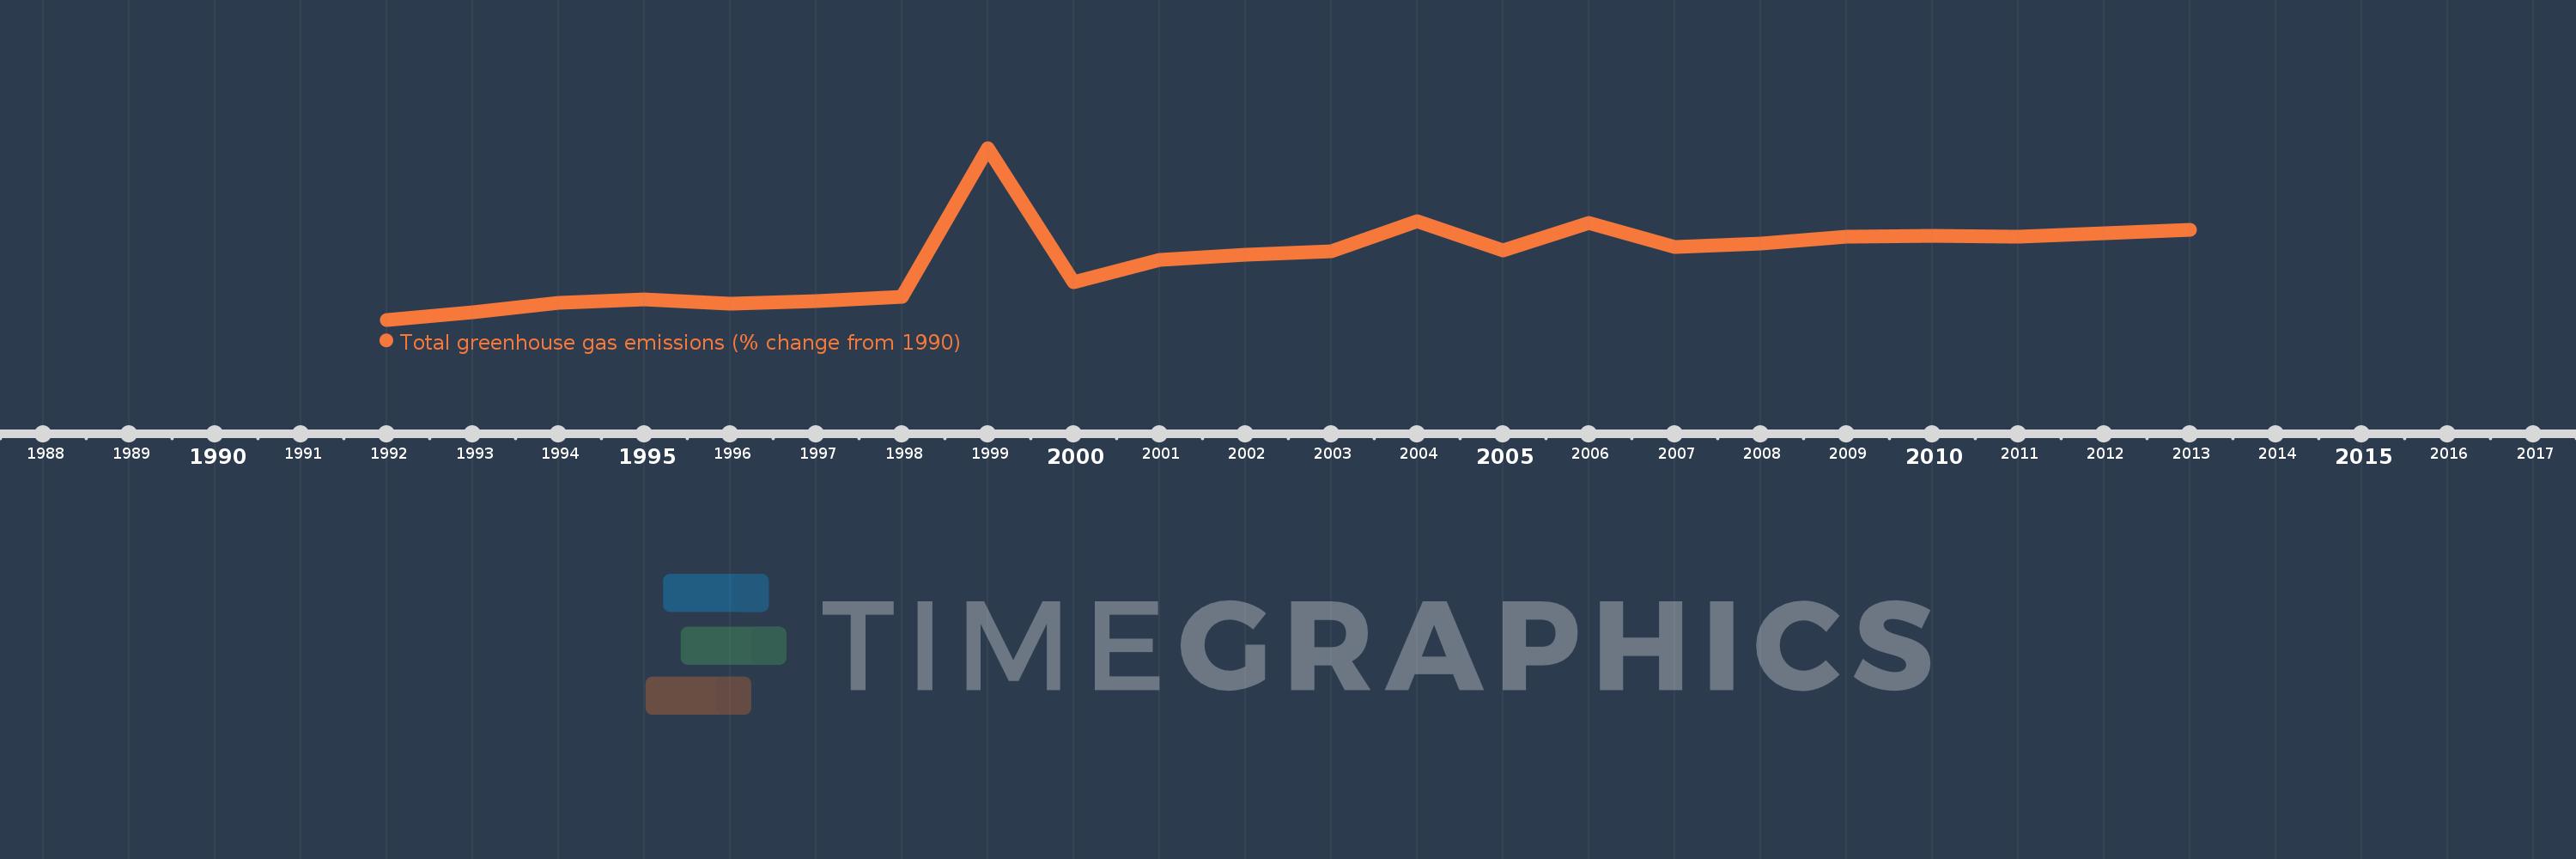
This timeline shows a graph from 1992 to 2013 of Nicaragua. No data until 1991. Number of actual observations by date: 22.
Source name:
World Development Indicators
Source organization:
World Bank staff estimates from original source: European Commission, Joint Research Centre (JRC)/Netherlands Environmental Assessment Agency (PBL). Emission Database for Global Atmospheric Research (EDGAR): http://edgar.jrc.ec.europa.eu/.
Categories, topics:
Climate Change, Environment
Last updated:
apr 23, 2017
Indicators value changes by year
Meaning:
37.997
Minimum:
-6.762
jan 1, 1992
Maximum:
119.175
jan 1, 1999
At the date of observation
Value
Absolute change
Change from the previous value
jan 1, 1992
-6.762
-6.762
0.0%
jan 1, 1993
-1.257
+5.505
-81.42%
jan 1, 1994
5.585
+6.842
-544.44%
jan 1, 1995
7.978
+2.393
42.84%
jan 1, 1996
4.927
-3.051
-38.24%
jan 1, 1997
6.988
+2.062
41.84%
jan 1, 1998
10.35
+3.362
48.11%
jan 1, 1999
119.175
+108.824
1.05K%
jan 1, 2000
20.988
-98.186
-82.39%
jan 1, 2001
36.828
+15.839
75.47%
jan 1, 2002
40.914
+4.086
11.09%
jan 1, 2003
43.42
+2.506
6.12%
jan 1, 2004
65.298
+21.879
50.39%
jan 1, 2005
44.134
-21.165
-32.41%
jan 1, 2006
63.998
+19.864
45.01%
jan 1, 2007
46.62
-17.377
-27.15%
jan 1, 2008
48.847
+2.226
4.78%
jan 1, 2009
53.866
+5.019
10.27%
jan 1, 2010
54.548
+0.682
1.27%
jan 1, 2011
53.889
-0.659
-1.21%
jan 1, 2012
56.561
+2.672
4.96%
jan 1, 2013
59.04
+2.479
4.38%
Ranking of countries by current statistics by years