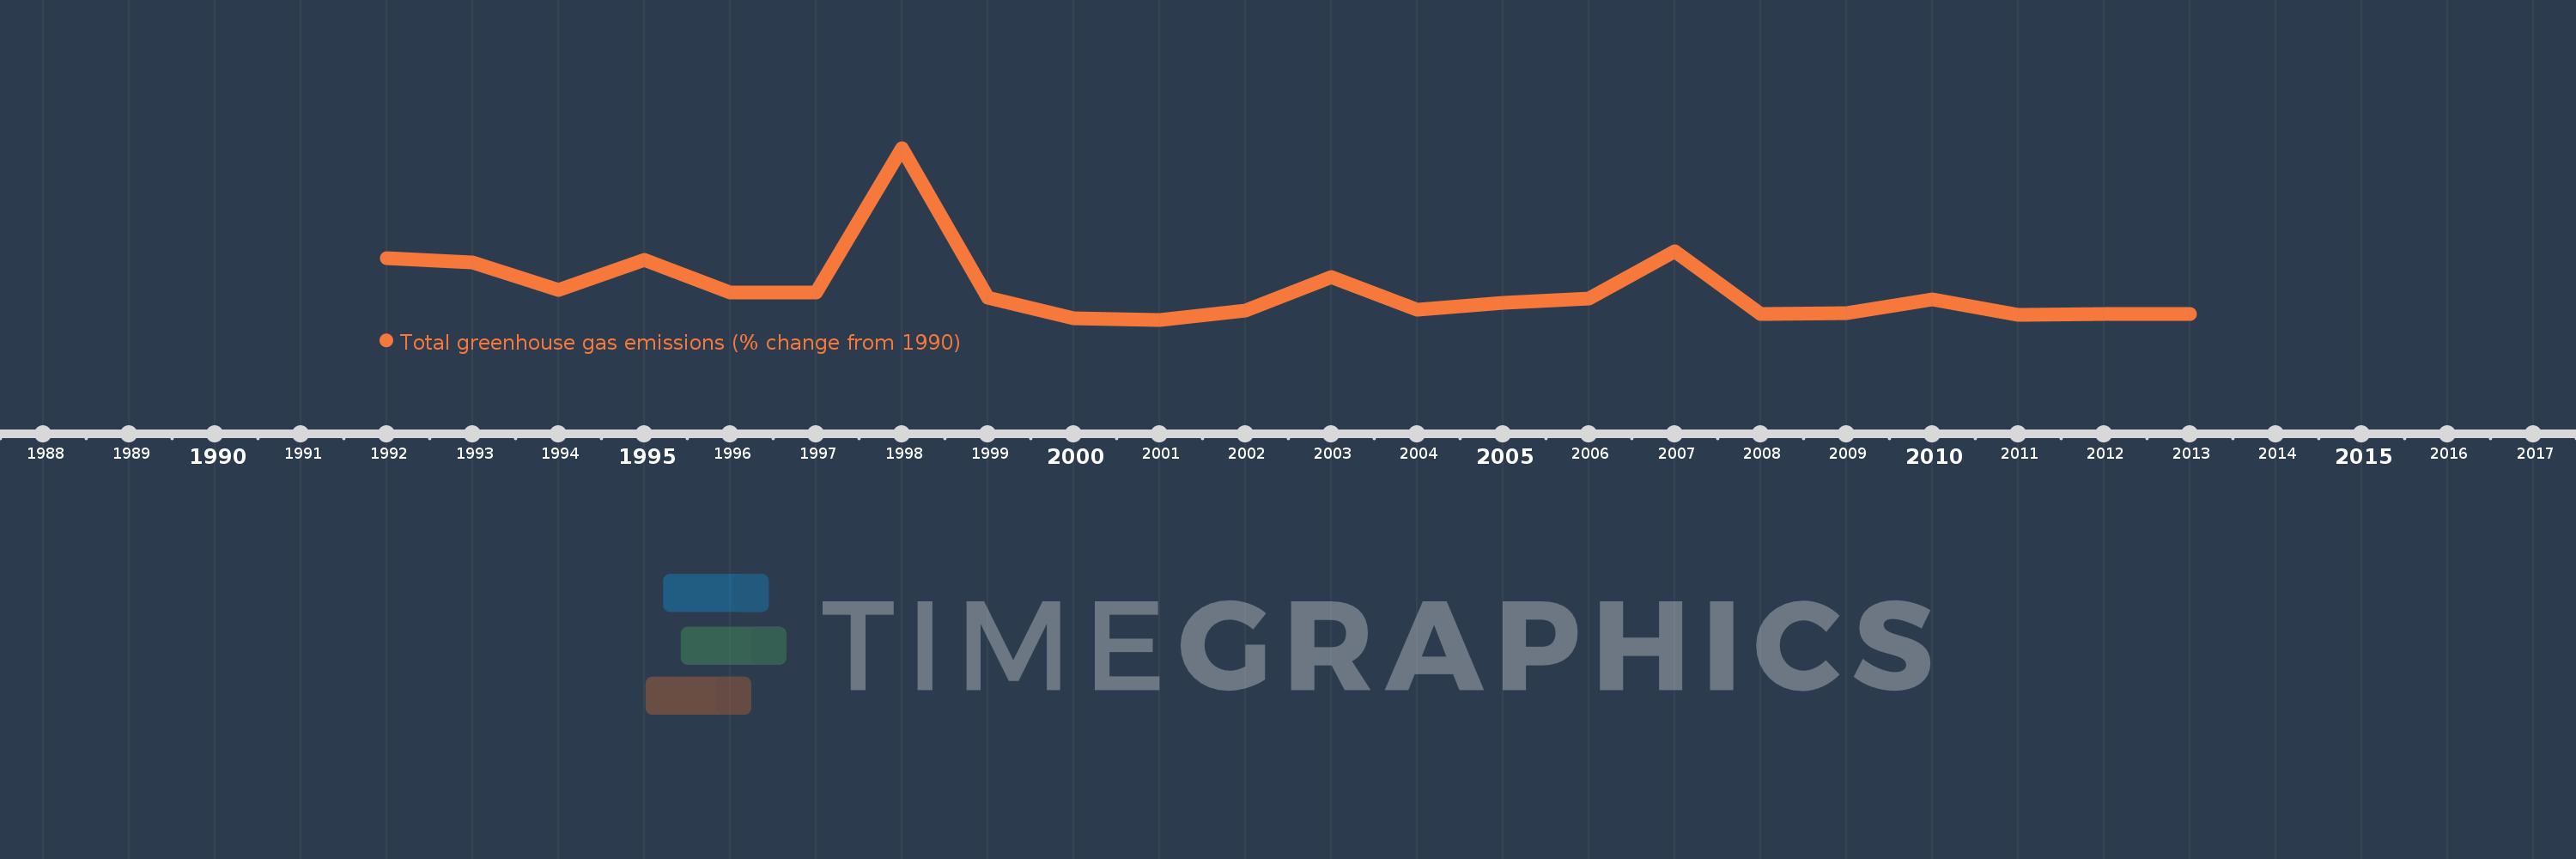
This timeline shows a graph from 1992 to 2013 of Indonesia. No data until 1991. Number of actual observations by date: 22.
Source name:
World Development Indicators
Source organization:
World Bank staff estimates from original source: European Commission, Joint Research Centre (JRC)/Netherlands Environmental Assessment Agency (PBL). Emission Database for Global Atmospheric Research (EDGAR): http://edgar.jrc.ec.europa.eu/.
Categories, topics:
Climate Change, Environment
Last updated:
apr 23, 2017
Indicators value changes by year
Meaning:
21.309
Minimum:
-46.575
jan 1, 2001
Maximum:
332.648
jan 1, 1998
At the date of observation
Value
Absolute change
Change from the previous value
jan 1, 1992
89.927
+89.927
0.0%
jan 1, 1993
80.025
-9.903
-11.01%
jan 1, 1994
19.86
-60.164
-75.18%
jan 1, 1995
85.066
+65.206
328.32%
jan 1, 1996
12.914
-72.153
-84.82%
jan 1, 1997
12.784
-0.13
-1.0%
jan 1, 1998
332.648
+319.864
2.5K%
jan 1, 1999
2.238
-330.41
-99.33%
jan 1, 2000
-42.59
-44.828
-2.0K%
jan 1, 2001
-46.575
-3.984
9.36%
jan 1, 2002
-27.05
+19.524
-41.92%
jan 1, 2003
47.663
+74.714
-276.2%
jan 1, 2004
-23.729
-71.392
-149.78%
jan 1, 2005
-9.003
+14.725
-62.06%
jan 1, 2006
0.509
+9.512
-105.65%
jan 1, 2007
104.383
+103.874
20.41K%
jan 1, 2008
-33.659
-138.042
-132.25%
jan 1, 2009
-31.631
+2.029
-6.03%
jan 1, 2010
-1.444
+30.186
-95.43%
jan 1, 2011
-36.076
-34.631
2.4K%
jan 1, 2012
-34.465
+1.61
-4.46%
jan 1, 2013
-33.006
+1.459
-4.23%
Ranking of countries by current statistics by years