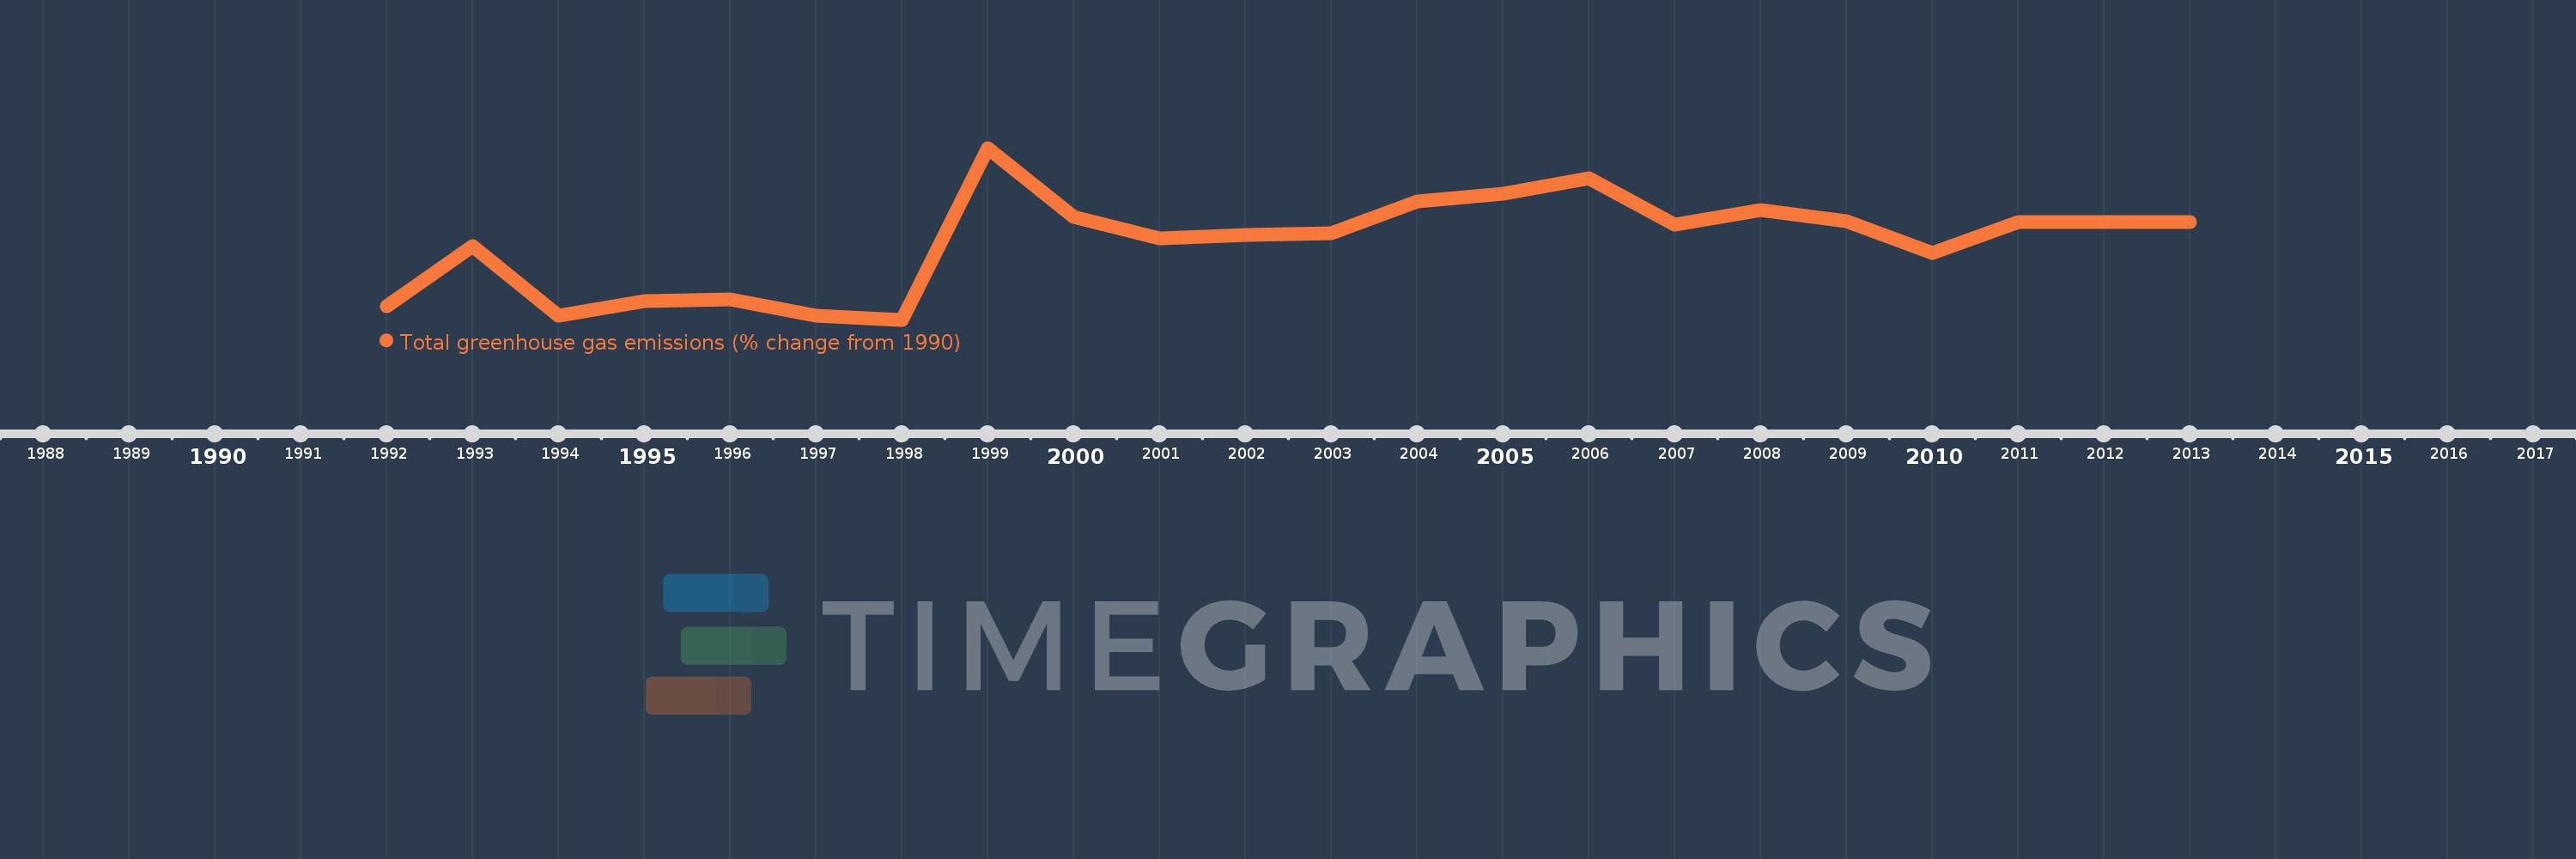
This timeline shows a graph from 1992 to 2013 of Zambia. No data until 1991. Number of actual observations by date: 22.
Source name:
World Development Indicators
Source organization:
World Bank staff estimates from original source: European Commission, Joint Research Centre (JRC)/Netherlands Environmental Assessment Agency (PBL). Emission Database for Global Atmospheric Research (EDGAR): http://edgar.jrc.ec.europa.eu/.
Categories, topics:
Climate Change, Environment
Last updated:
apr 23, 2017
Indicators value changes by year
Meaning:
36.032
Minimum:
-28.458
jan 1, 1998
Maximum:
113.983
jan 1, 1999
At the date of observation
Value
Absolute change
Change from the previous value
jan 1, 1992
-16.983
-16.983
0.0%
jan 1, 1993
32.727
+49.709
-292.7%
jan 1, 1994
-25.338
-58.065
-177.42%
jan 1, 1995
-12.861
+12.478
-49.24%
jan 1, 1996
-11.672
+1.189
-9.24%
jan 1, 1997
-25.265
-13.593
116.46%
jan 1, 1998
-28.458
-3.193
12.64%
jan 1, 1999
113.983
+142.441
-500.53%
jan 1, 2000
56.912
-57.071
-50.07%
jan 1, 2001
38.714
-18.198
-31.98%
jan 1, 2002
41.881
+3.167
8.18%
jan 1, 2003
43.269
+1.388
3.31%
jan 1, 2004
69.82
+26.55
61.36%
jan 1, 2005
76.007
+6.187
8.86%
jan 1, 2006
89.1
+13.094
17.23%
jan 1, 2007
50.153
-38.948
-43.71%
jan 1, 2008
62.656
+12.503
24.93%
jan 1, 2009
53.191
-9.464
-15.11%
jan 1, 2010
26.935
-26.256
-49.36%
jan 1, 2011
52.533
+25.598
95.04%
jan 1, 2012
52.648
+0.115
0.22%
jan 1, 2013
52.757
+0.109
0.21%
Ranking of countries by current statistics by years