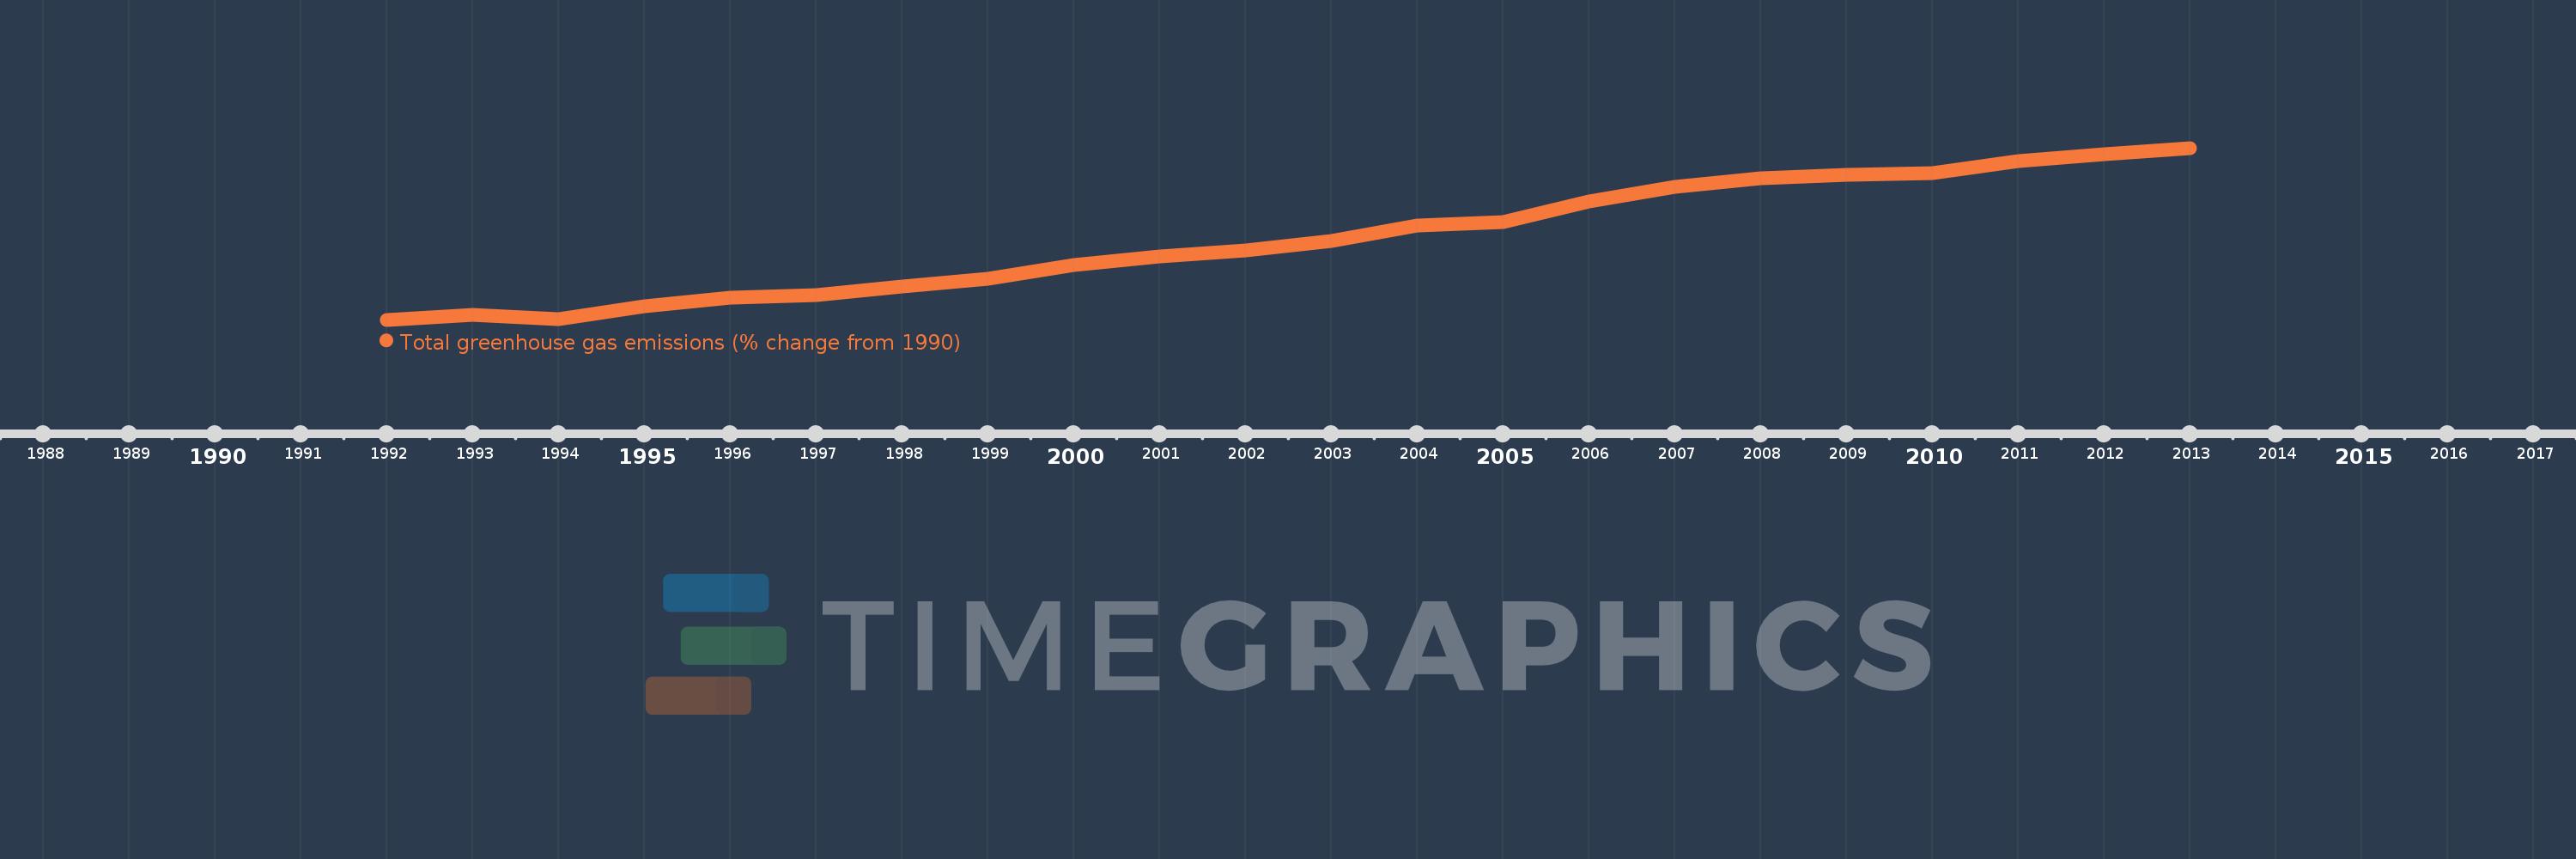
This timeline shows a graph from 1992 to 2013 of Yemen, Rep.. No data until 1991. Number of actual observations by date: 22.
Source name:
World Development Indicators
Source organization:
World Bank staff estimates from original source: European Commission, Joint Research Centre (JRC)/Netherlands Environmental Assessment Agency (PBL). Emission Database for Global Atmospheric Research (EDGAR): http://edgar.jrc.ec.europa.eu/.
Categories, topics:
Climate Change, Environment
Last updated:
apr 23, 2017
Indicators value changes by year
Meaning:
109.671
Minimum:
13.124
jan 1, 1992
Maximum:
218.479
jan 1, 2013
At the date of observation
Value
Absolute change
Change from the previous value
jan 1, 1992
13.124
+13.124
0.0%
jan 1, 1993
19.359
+6.235
47.51%
jan 1, 1994
13.642
-5.717
-29.53%
jan 1, 1995
29.347
+15.705
115.12%
jan 1, 1996
39.179
+9.832
33.5%
jan 1, 1997
43.084
+3.905
9.97%
jan 1, 1998
53.121
+10.037
23.3%
jan 1, 1999
62.411
+9.29
17.49%
jan 1, 2000
78.176
+15.766
25.26%
jan 1, 2001
88.523
+10.346
13.23%
jan 1, 2002
96.19
+7.667
8.66%
jan 1, 2003
106.849
+10.659
11.08%
jan 1, 2004
125.55
+18.701
17.5%
jan 1, 2005
129.683
+4.133
3.29%
jan 1, 2006
154.211
+24.528
18.91%
jan 1, 2007
172.058
+17.846
11.57%
jan 1, 2008
181.911
+9.854
5.73%
jan 1, 2009
186.383
+4.472
2.46%
jan 1, 2010
188.149
+1.766
0.95%
jan 1, 2011
202.453
+14.304
7.6%
jan 1, 2012
210.887
+8.434
4.17%
jan 1, 2013
218.479
+7.592
3.6%
Ranking of countries by current statistics by years