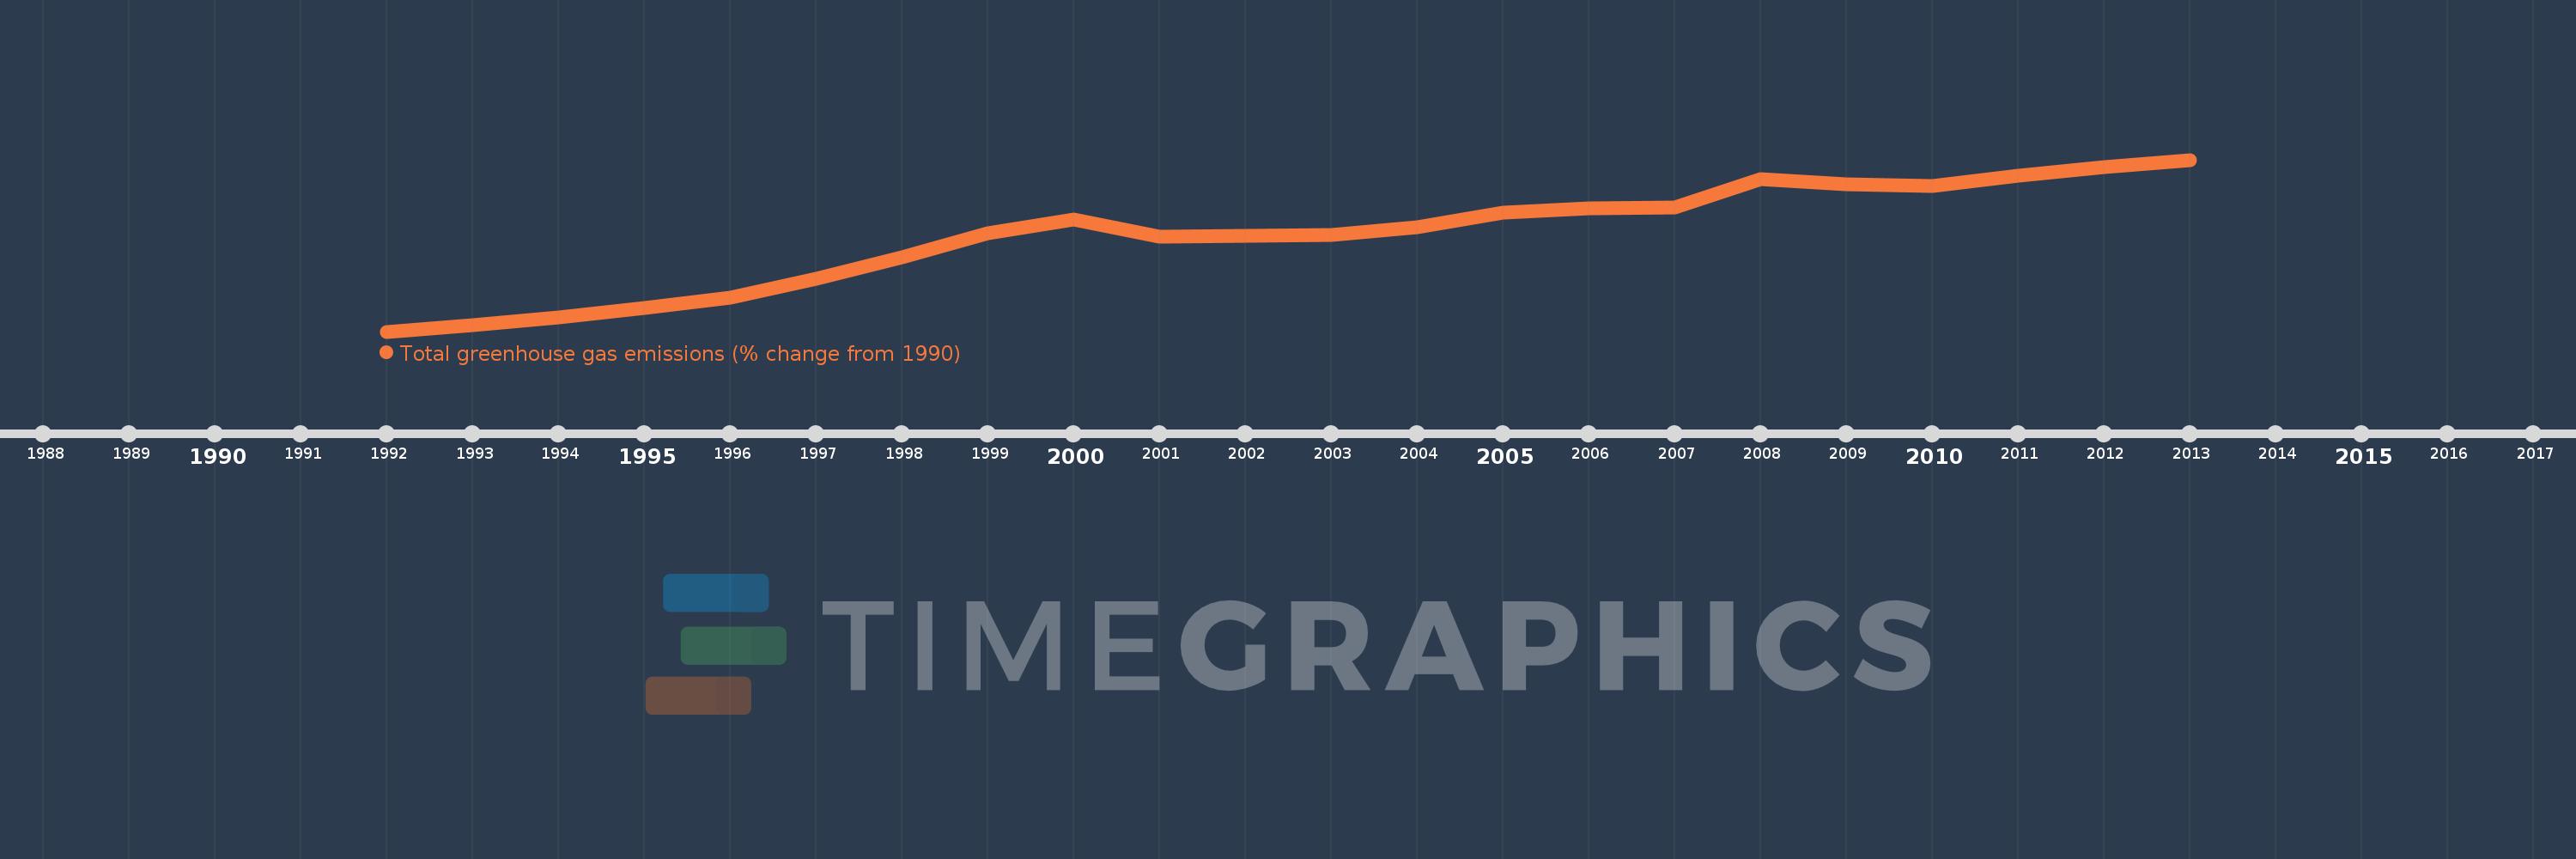
This timeline shows a graph from 1992 to 2013 of Chile. No data until 1991. Number of actual observations by date: 22.
Source name:
World Development Indicators
Source organization:
World Bank staff estimates from original source: European Commission, Joint Research Centre (JRC)/Netherlands Environmental Assessment Agency (PBL). Emission Database for Global Atmospheric Research (EDGAR): http://edgar.jrc.ec.europa.eu/.
Categories, topics:
Climate Change, Environment
Last updated:
apr 23, 2017
Indicators value changes by year
Meaning:
65.902
Minimum:
-3.279
jan 1, 1992
Maximum:
120.514
jan 1, 2013
At the date of observation
Value
Absolute change
Change from the previous value
jan 1, 1992
-3.279
-3.279
0.0%
jan 1, 1993
1.251
+4.53
-138.14%
jan 1, 1994
6.79
+5.539
442.9%
jan 1, 1995
13.788
+6.999
103.08%
jan 1, 1996
21.382
+7.594
55.08%
jan 1, 1997
34.527
+13.145
61.47%
jan 1, 1998
50.543
+16.016
46.39%
jan 1, 1999
67.417
+16.874
33.39%
jan 1, 2000
77.399
+9.982
14.81%
jan 1, 2001
65.145
-12.254
-15.83%
jan 1, 2002
66.018
+0.873
1.34%
jan 1, 2003
66.661
+0.643
0.97%
jan 1, 2004
72.183
+5.522
8.28%
jan 1, 2005
82.492
+10.309
14.28%
jan 1, 2006
85.627
+3.135
3.8%
jan 1, 2007
86.305
+0.677
0.79%
jan 1, 2008
106.7
+20.395
23.63%
jan 1, 2009
102.851
-3.848
-3.61%
jan 1, 2010
101.725
-1.126
-1.1%
jan 1, 2011
108.815
+7.09
6.97%
jan 1, 2012
114.985
+6.17
5.67%
jan 1, 2013
120.514
+5.529
4.81%
Ranking of countries by current statistics by years