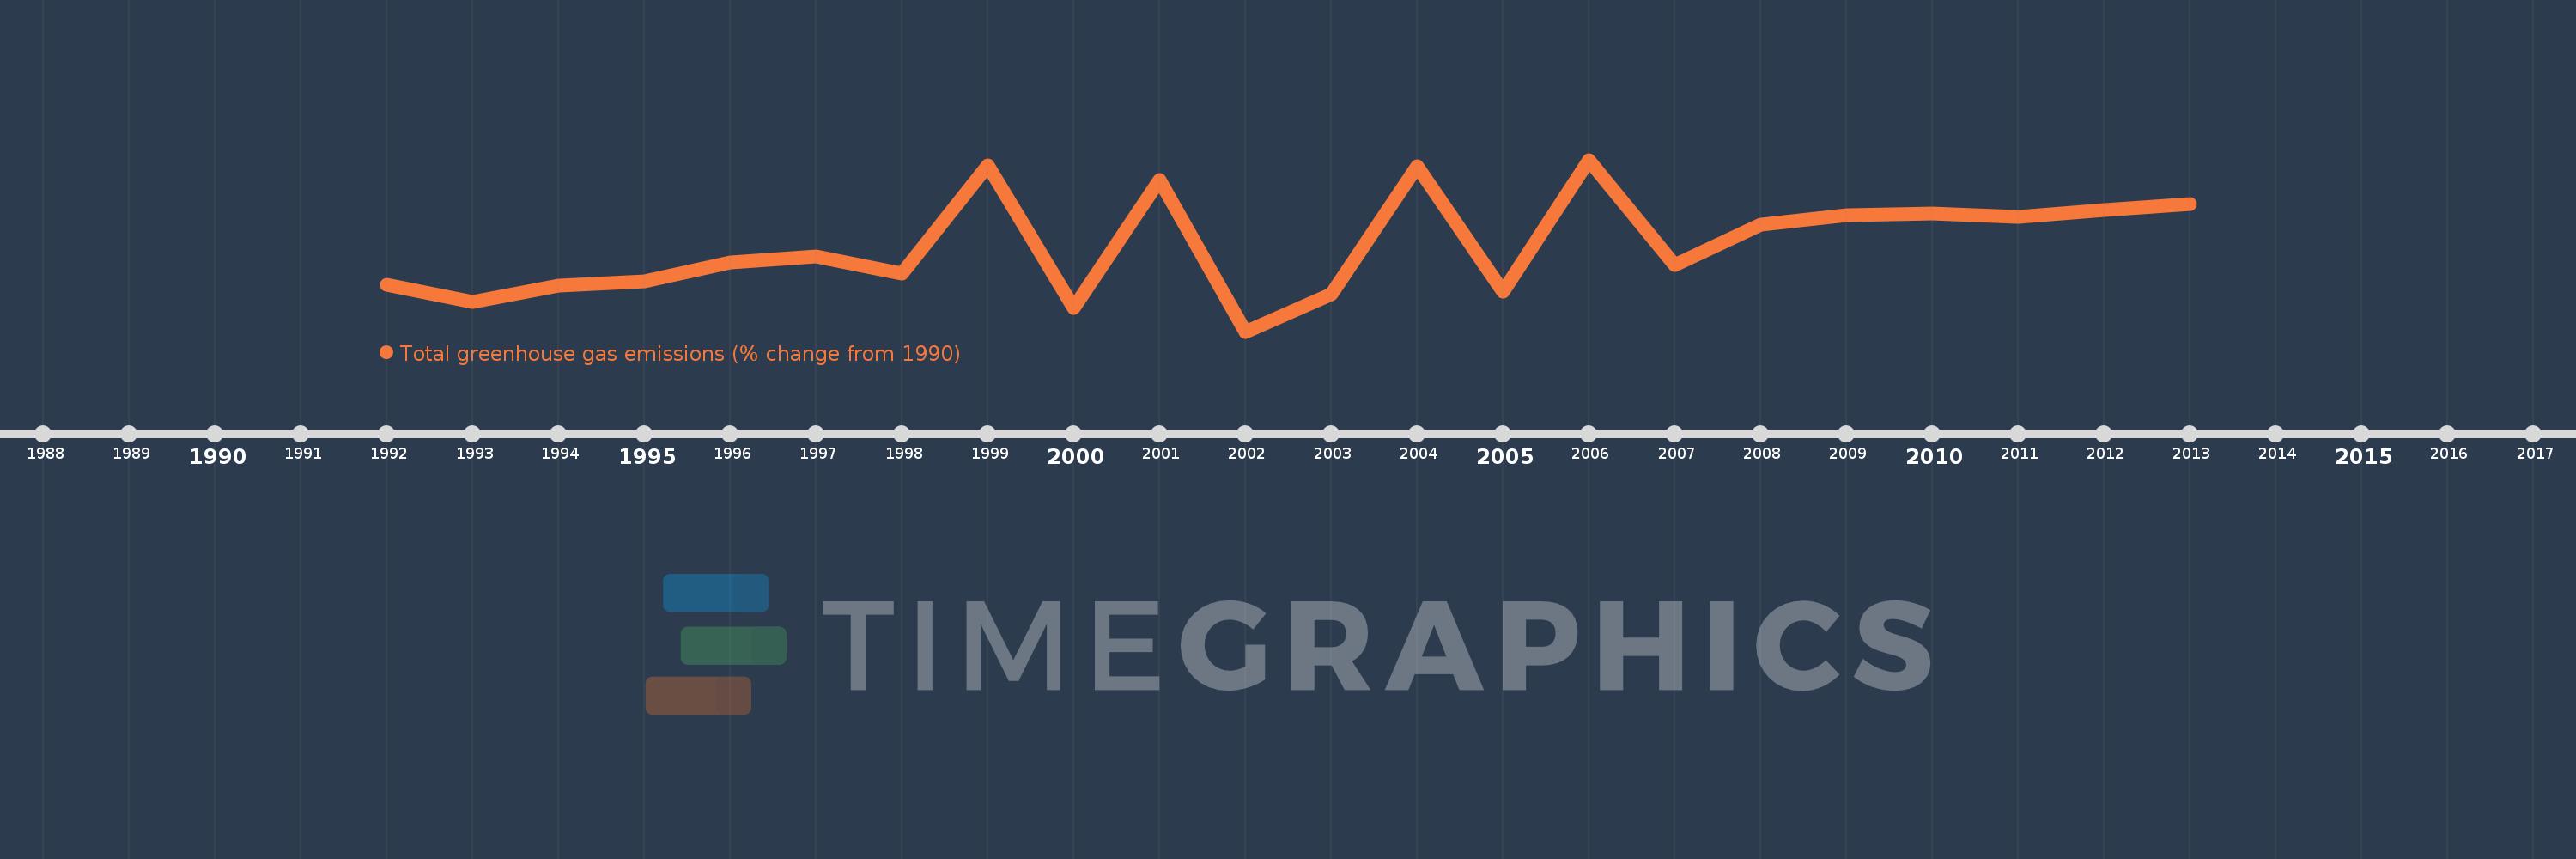
This timeline shows a graph from 1992 to 2013 of Honduras. No data until 1991. Number of actual observations by date: 22.
Source name:
World Development Indicators
Source organization:
World Bank staff estimates from original source: European Commission, Joint Research Centre (JRC)/Netherlands Environmental Assessment Agency (PBL). Emission Database for Global Atmospheric Research (EDGAR): http://edgar.jrc.ec.europa.eu/.
Categories, topics:
Climate Change, Environment
Last updated:
apr 23, 2017
Indicators value changes by year
Meaning:
30.472
Minimum:
-8.637
jan 1, 2002
Maximum:
69.12
jan 1, 2006
At the date of observation
Value
Absolute change
Change from the previous value
jan 1, 1992
12.507
+12.507
0.0%
jan 1, 1993
4.843
-7.664
-61.28%
jan 1, 1994
12.033
+7.19
148.47%
jan 1, 1995
13.916
+1.883
15.65%
jan 1, 1996
22.596
+8.68
62.38%
jan 1, 1997
25.25
+2.654
11.75%
jan 1, 1998
17.466
-7.785
-30.83%
jan 1, 1999
66.433
+48.968
280.37%
jan 1, 2000
2.007
-64.426
-96.98%
jan 1, 2001
59.812
+57.805
2.88K%
jan 1, 2002
-8.637
-68.449
-114.44%
jan 1, 2003
8.355
+16.992
-196.73%
jan 1, 2004
66.1
+57.745
691.16%
jan 1, 2005
9.358
-56.742
-85.84%
jan 1, 2006
69.12
+59.762
638.62%
jan 1, 2007
21.604
-47.516
-68.74%
jan 1, 2008
39.764
+18.16
84.06%
jan 1, 2009
44.19
+4.426
11.13%
jan 1, 2010
44.858
+0.668
1.51%
jan 1, 2011
43.299
-1.558
-3.47%
jan 1, 2012
46.363
+3.064
7.08%
jan 1, 2013
49.155
+2.791
6.02%
Ranking of countries by current statistics by years