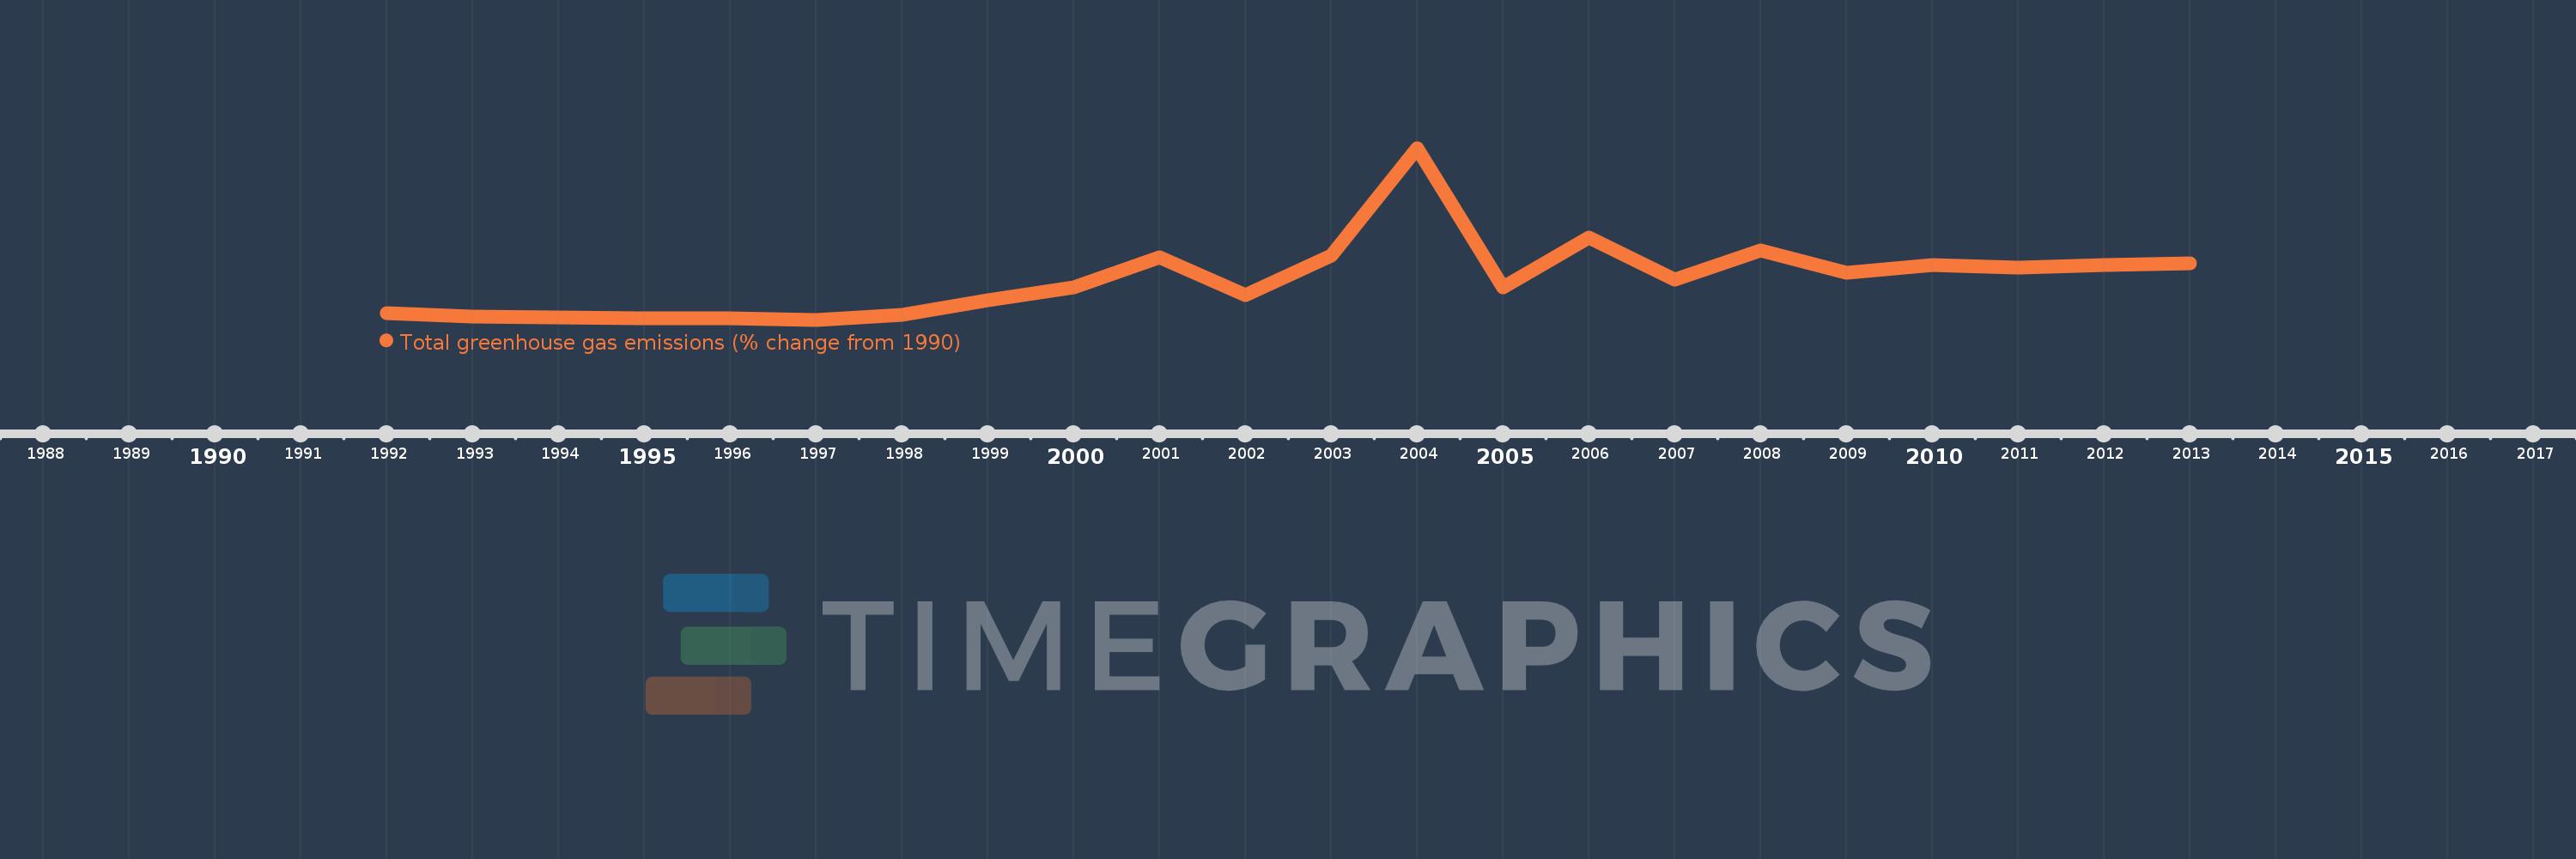
This timeline shows a graph from 1992 to 2013 of Belize. No data until 1991. Number of actual observations by date: 22.
Source name:
World Development Indicators
Source organization:
World Bank staff estimates from original source: European Commission, Joint Research Centre (JRC)/Netherlands Environmental Assessment Agency (PBL). Emission Database for Global Atmospheric Research (EDGAR): http://edgar.jrc.ec.europa.eu/.
Categories, topics:
Climate Change, Environment
Last updated:
apr 23, 2017
Indicators value changes by year
Meaning:
102.745
Minimum:
-9.286
jan 1, 1997
Maximum:
469.657
jan 1, 2004
At the date of observation
Value
Absolute change
Change from the previous value
jan 1, 1992
9.073
+9.073
0.0%
jan 1, 1993
-0.005
-9.078
-100.05%
jan 1, 1994
-3.876
-3.871
79.2K%
jan 1, 1995
-6.3
-2.424
62.53%
jan 1, 1996
-4.708
+1.592
-25.28%
jan 1, 1997
-9.286
-4.578
97.24%
jan 1, 1998
4.734
+14.02
-150.98%
jan 1, 1999
45.9
+41.166
869.51%
jan 1, 2000
80.757
+34.856
75.94%
jan 1, 2001
164.964
+84.207
104.27%
jan 1, 2002
60.18
-104.784
-63.52%
jan 1, 2003
169.092
+108.912
180.98%
jan 1, 2004
469.657
+300.566
177.75%
jan 1, 2005
81.138
-388.519
-82.72%
jan 1, 2006
219.604
+138.466
170.66%
jan 1, 2007
101.758
-117.845
-53.66%
jan 1, 2008
184.83
+83.071
81.64%
jan 1, 2009
122.556
-62.273
-33.69%
jan 1, 2010
142.504
+19.948
16.28%
jan 1, 2011
136.896
-5.609
-3.94%
jan 1, 2012
142.8
+5.905
4.31%
jan 1, 2013
148.114
+5.314
3.72%
Ranking of countries by current statistics by years