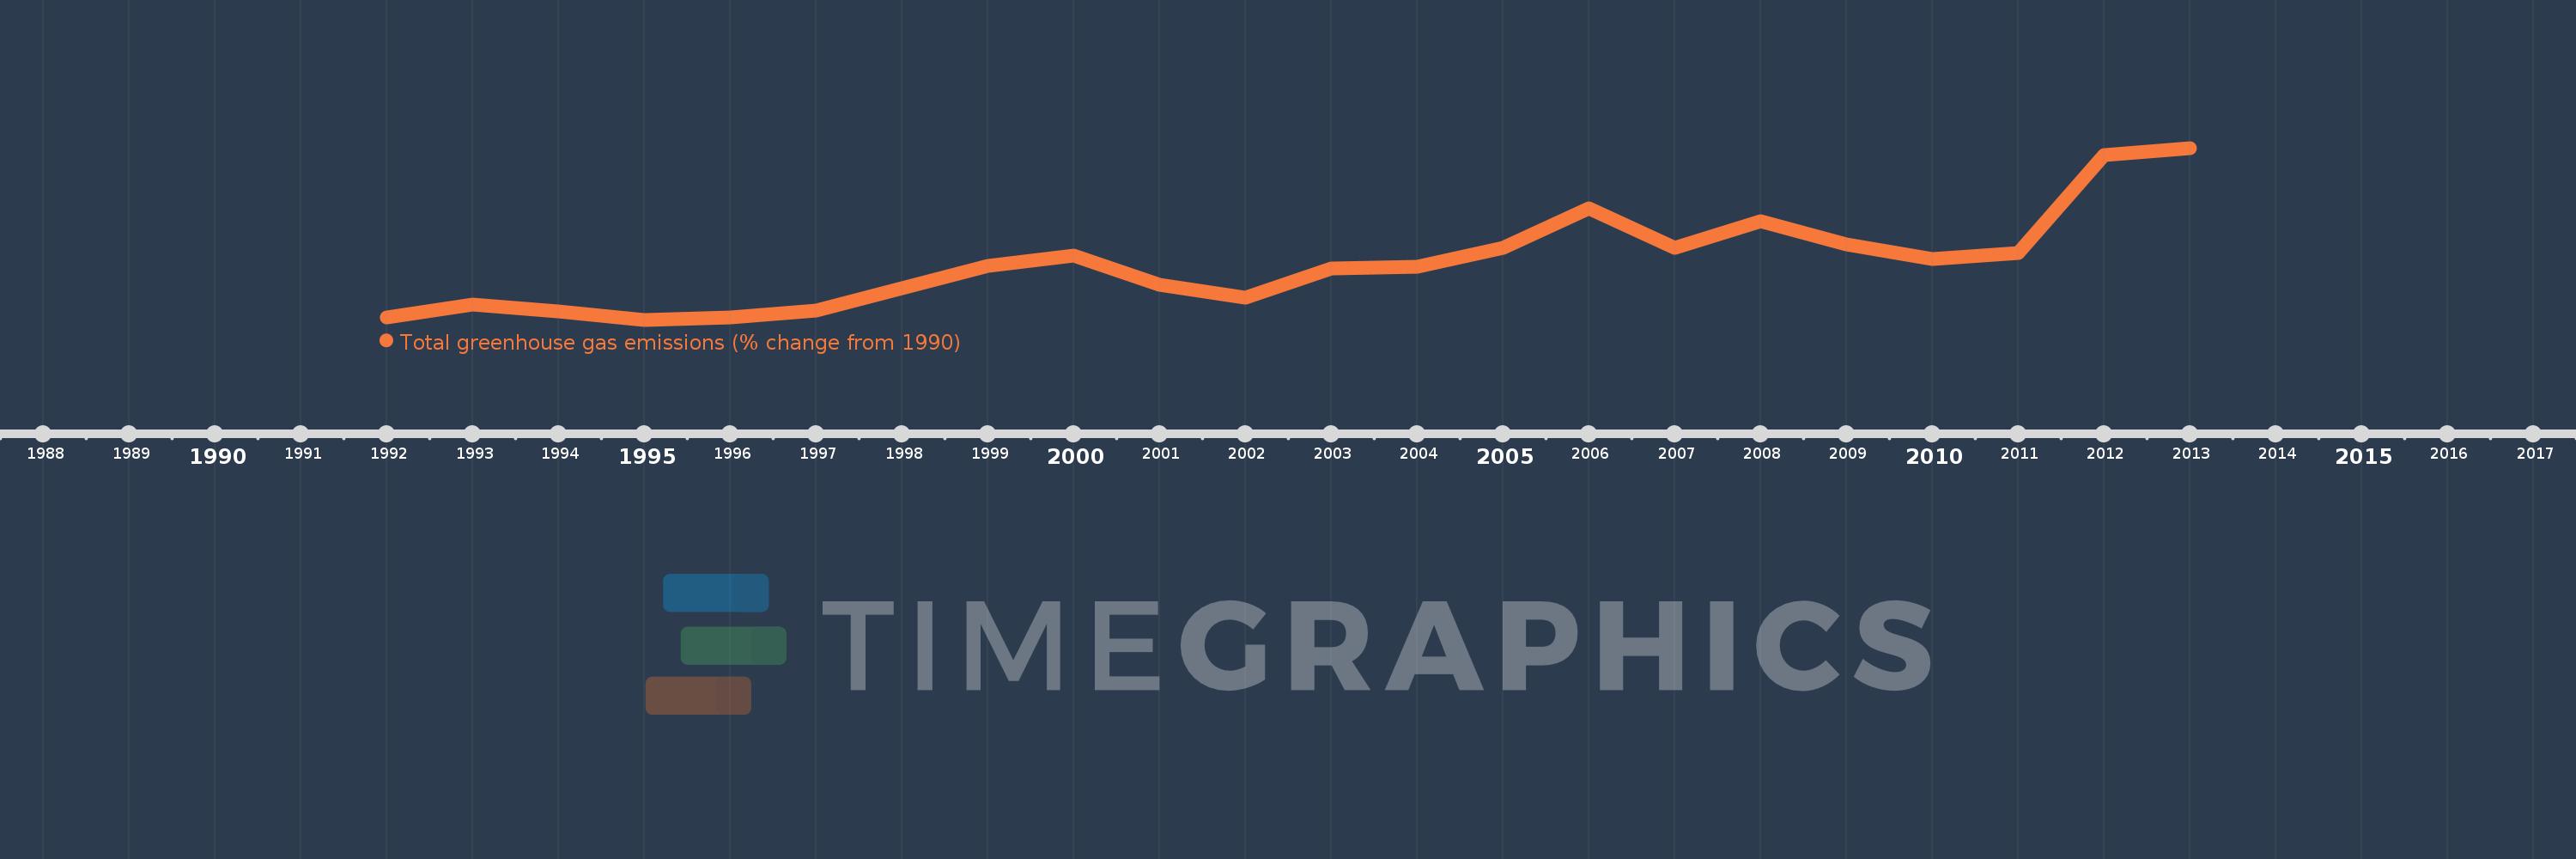
This timeline shows a graph from 1992 to 2013 of IDA blend. No data until 1991. Number of actual observations by date: 22.
Source name:
World Development Indicators
Source organization:
World Bank staff estimates from original source: European Commission, Joint Research Centre (JRC)/Netherlands Environmental Assessment Agency (PBL). Emission Database for Global Atmospheric Research (EDGAR): http://edgar.jrc.ec.europa.eu/.
Categories, topics:
Climate Change, Environment
Last updated:
apr 23, 2017
Indicators value changes by year
Meaning:
25.66
Minimum:
-0.741
jan 1, 1995
Maximum:
79.618
jan 1, 2013
At the date of observation
Value
Absolute change
Change from the previous value
jan 1, 1992
0.226
+0.226
0.0%
jan 1, 1993
6.328
+6.102
2.7K%
jan 1, 1994
3.113
-3.216
-50.81%
jan 1, 1995
-0.741
-3.853
-123.8%
jan 1, 1996
0.333
+1.074
-145.02%
jan 1, 1997
3.662
+3.328
998.0%
jan 1, 1998
14.122
+10.461
285.67%
jan 1, 1999
24.419
+10.297
72.91%
jan 1, 2000
29.309
+4.89
20.03%
jan 1, 2001
15.49
-13.82
-47.15%
jan 1, 2002
9.547
-5.943
-38.37%
jan 1, 2003
23.145
+13.598
142.43%
jan 1, 2004
24.183
+1.039
4.49%
jan 1, 2005
32.756
+8.573
35.45%
jan 1, 2006
51.303
+18.547
56.62%
jan 1, 2007
33.08
-18.223
-35.52%
jan 1, 2008
45.157
+12.077
36.51%
jan 1, 2009
34.663
-10.494
-23.24%
jan 1, 2010
27.826
-6.837
-19.72%
jan 1, 2011
30.545
+2.719
9.77%
jan 1, 2012
76.425
+45.88
150.2%
jan 1, 2013
79.618
+3.193
4.18%
Ranking of countries by current statistics by years