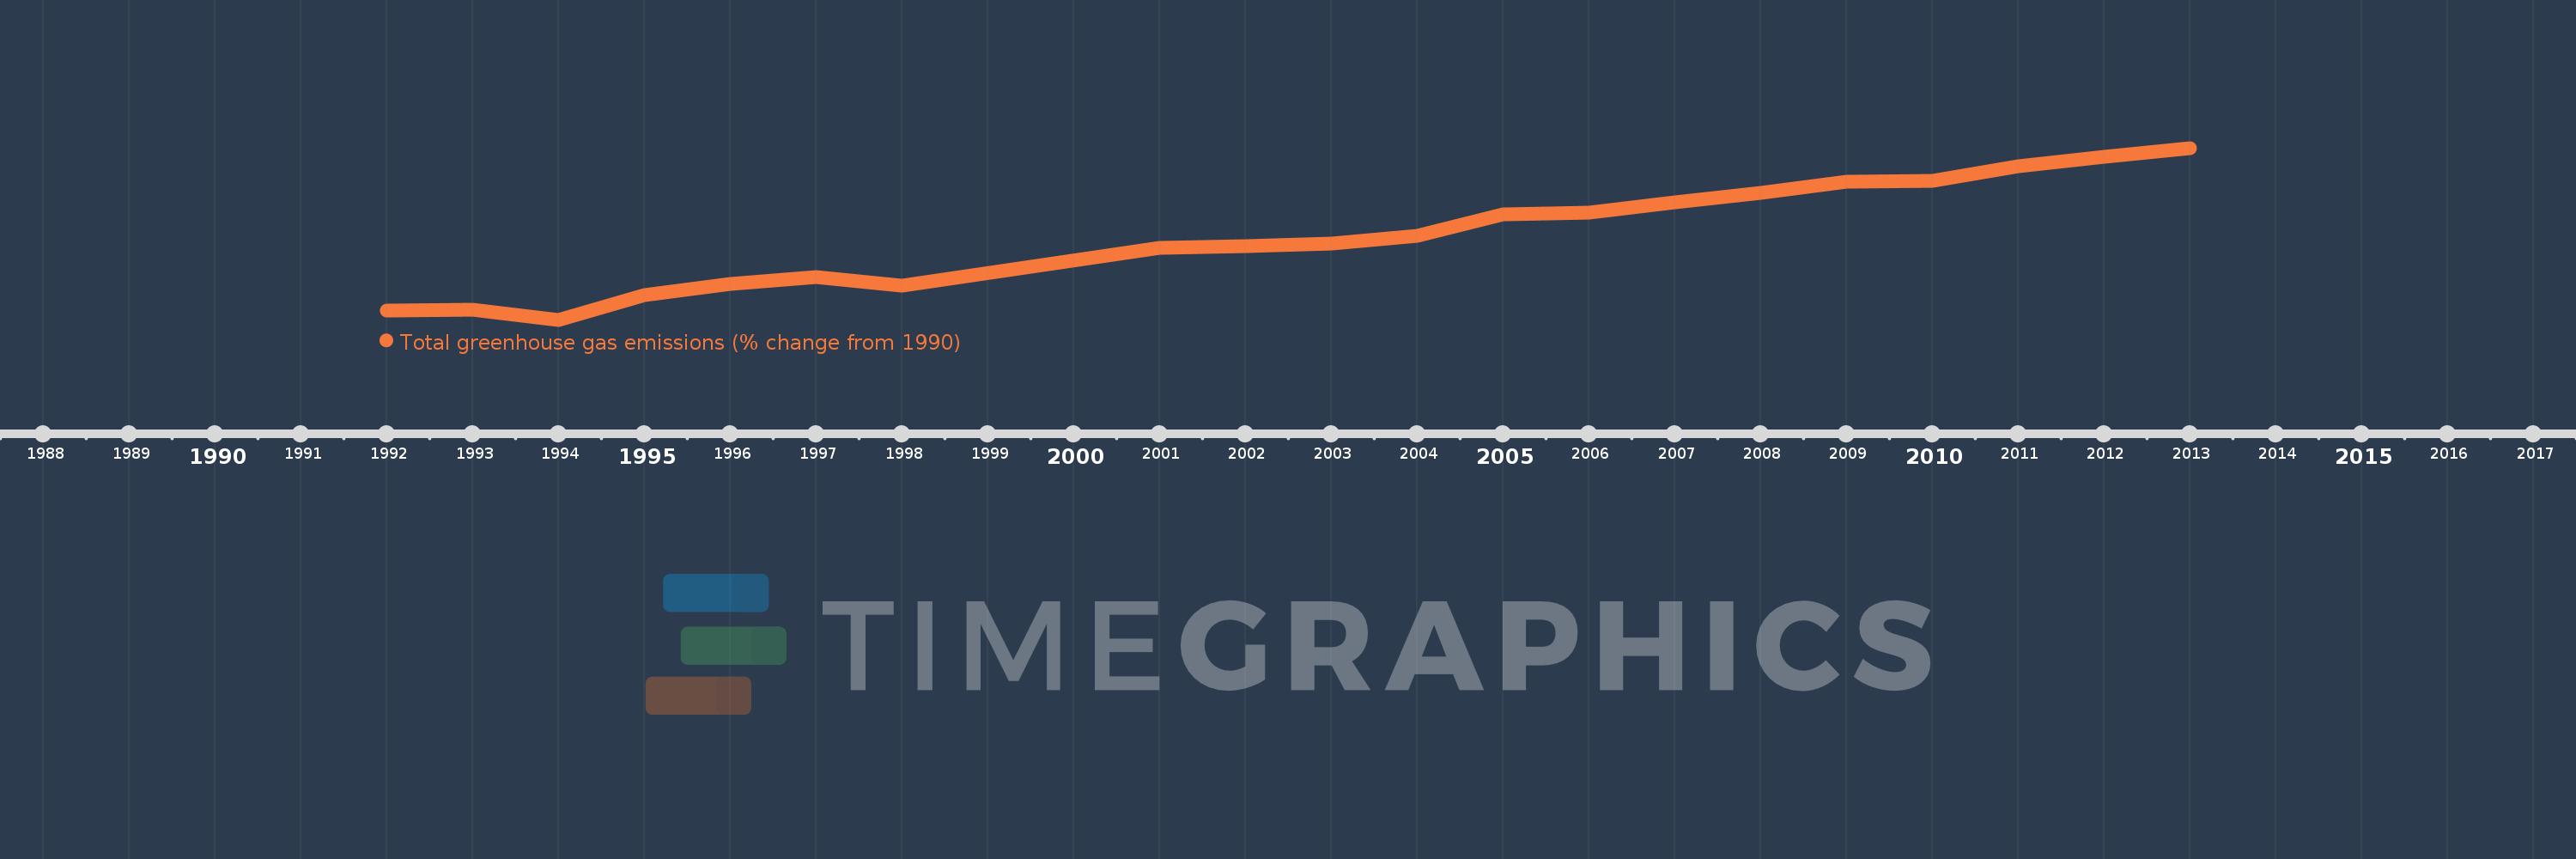
This timeline shows a graph from 1992 to 2013 of St. Lucia. No data until 1991. Number of actual observations by date: 20.
Source name:
World Development Indicators
Source organization:
World Bank staff estimates from original source: European Commission, Joint Research Centre (JRC)/Netherlands Environmental Assessment Agency (PBL). Emission Database for Global Atmospheric Research (EDGAR): http://edgar.jrc.ec.europa.eu/.
Categories, topics:
Climate Change, Environment
Last updated:
apr 23, 2017
Indicators value changes by year
Meaning:
54.086
Minimum:
-4.768
jan 1, 1994
Maximum:
115.293
jan 1, 2013
At the date of observation
Value
Absolute change
Change from the previous value
jan 1, 1992
1.42
+1.42
0.0%
jan 1, 1993
2.402
+0.983
69.23%
jan 1, 1994
-4.768
-7.171
-298.48%
jan 1, 1995
12.211
+16.979
-356.08%
jan 1, 1996
20.146
+7.935
64.99%
jan 1, 1997
25.019
+4.873
24.19%
jan 1, 1998
18.845
-6.173
-24.68%
jan 1, 2001
45.599
+26.754
141.97%
jan 1, 2002
46.794
+1.195
2.62%
jan 1, 2003
48.252
+1.458
3.12%
jan 1, 2004
53.653
+5.401
11.19%
jan 1, 2005
69.113
+15.46
28.82%
jan 1, 2006
70.096
+0.983
1.42%
jan 1, 2007
77.295
+7.199
10.27%
jan 1, 2008
84.187
+6.891
8.92%
jan 1, 2009
91.888
+7.702
9.15%
jan 1, 2010
92.134
+0.246
0.27%
jan 1, 2011
102.762
+10.629
11.54%
jan 1, 2012
109.386
+6.623
6.45%
jan 1, 2013
115.293
+5.908
5.4%
Ranking of countries by current statistics by years