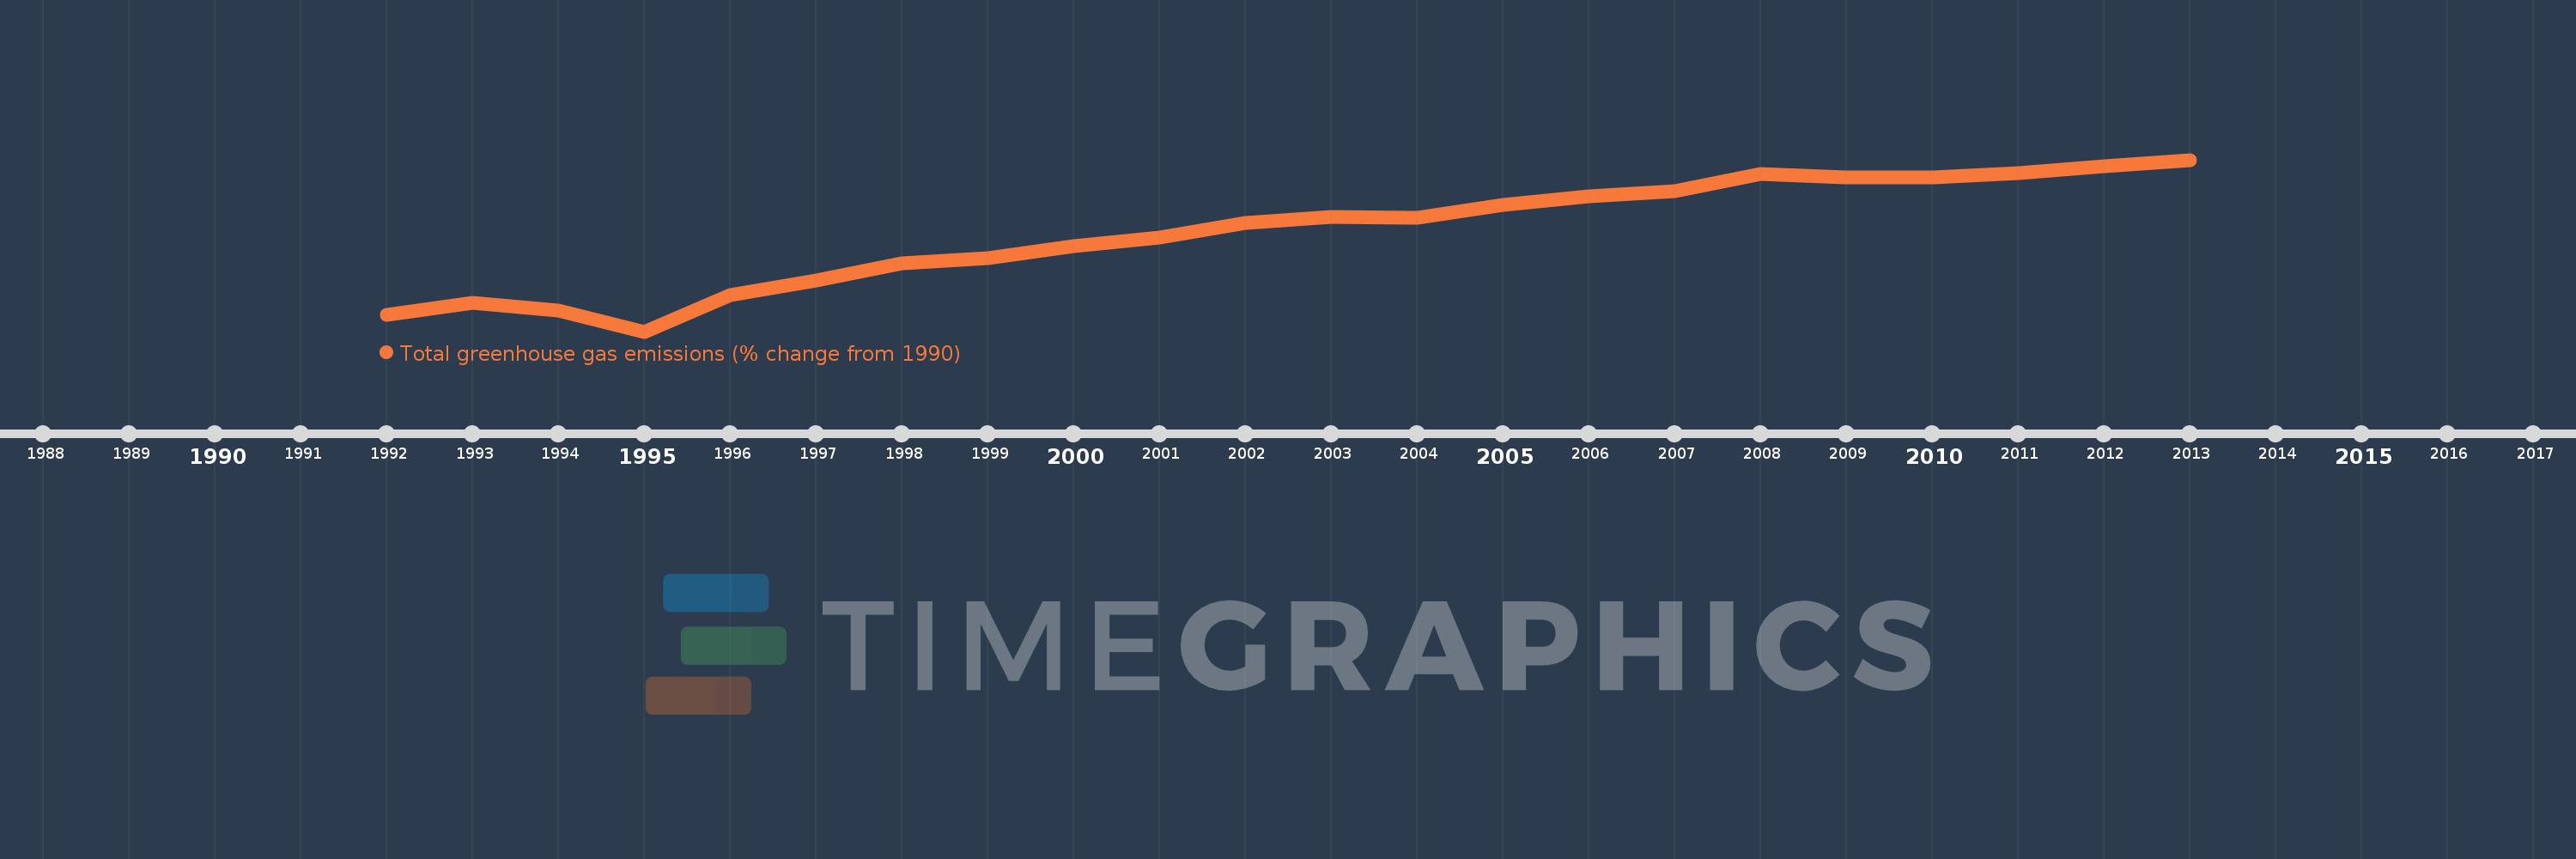
This timeline shows a graph from 1992 to 2013 of Haiti. No data until 1991. Number of actual observations by date: 22.
Source name:
World Development Indicators
Source organization:
World Bank staff estimates from original source: European Commission, Joint Research Centre (JRC)/Netherlands Environmental Assessment Agency (PBL). Emission Database for Global Atmospheric Research (EDGAR): http://edgar.jrc.ec.europa.eu/.
Categories, topics:
Climate Change, Environment
Last updated:
apr 23, 2017
Indicators value changes by year
Meaning:
35.982
Minimum:
-3.27
jan 1, 1995
Maximum:
64.934
jan 1, 2013
At the date of observation
Value
Absolute change
Change from the previous value
jan 1, 1992
3.343
+3.343
0.0%
jan 1, 1993
8.01
+4.667
139.59%
jan 1, 1994
5.086
-2.924
-36.51%
jan 1, 1995
-3.27
-8.355
-164.29%
jan 1, 1996
11.094
+14.364
-439.28%
jan 1, 1997
17.049
+5.955
53.68%
jan 1, 1998
23.807
+6.758
39.64%
jan 1, 1999
26.003
+2.196
9.22%
jan 1, 2000
30.682
+4.679
18.0%
jan 1, 2001
34.014
+3.332
10.86%
jan 1, 2002
39.976
+5.963
17.53%
jan 1, 2003
42.175
+2.198
5.5%
jan 1, 2004
41.85
-0.325
-0.77%
jan 1, 2005
46.935
+5.085
12.15%
jan 1, 2006
50.457
+3.521
7.5%
jan 1, 2007
52.505
+2.049
4.06%
jan 1, 2008
59.366
+6.861
13.07%
jan 1, 2009
57.969
-1.397
-2.35%
jan 1, 2010
57.797
-0.173
-0.3%
jan 1, 2011
59.514
+1.718
2.97%
jan 1, 2012
62.319
+2.805
4.71%
jan 1, 2013
64.934
+2.614
4.19%
Ranking of countries by current statistics by years