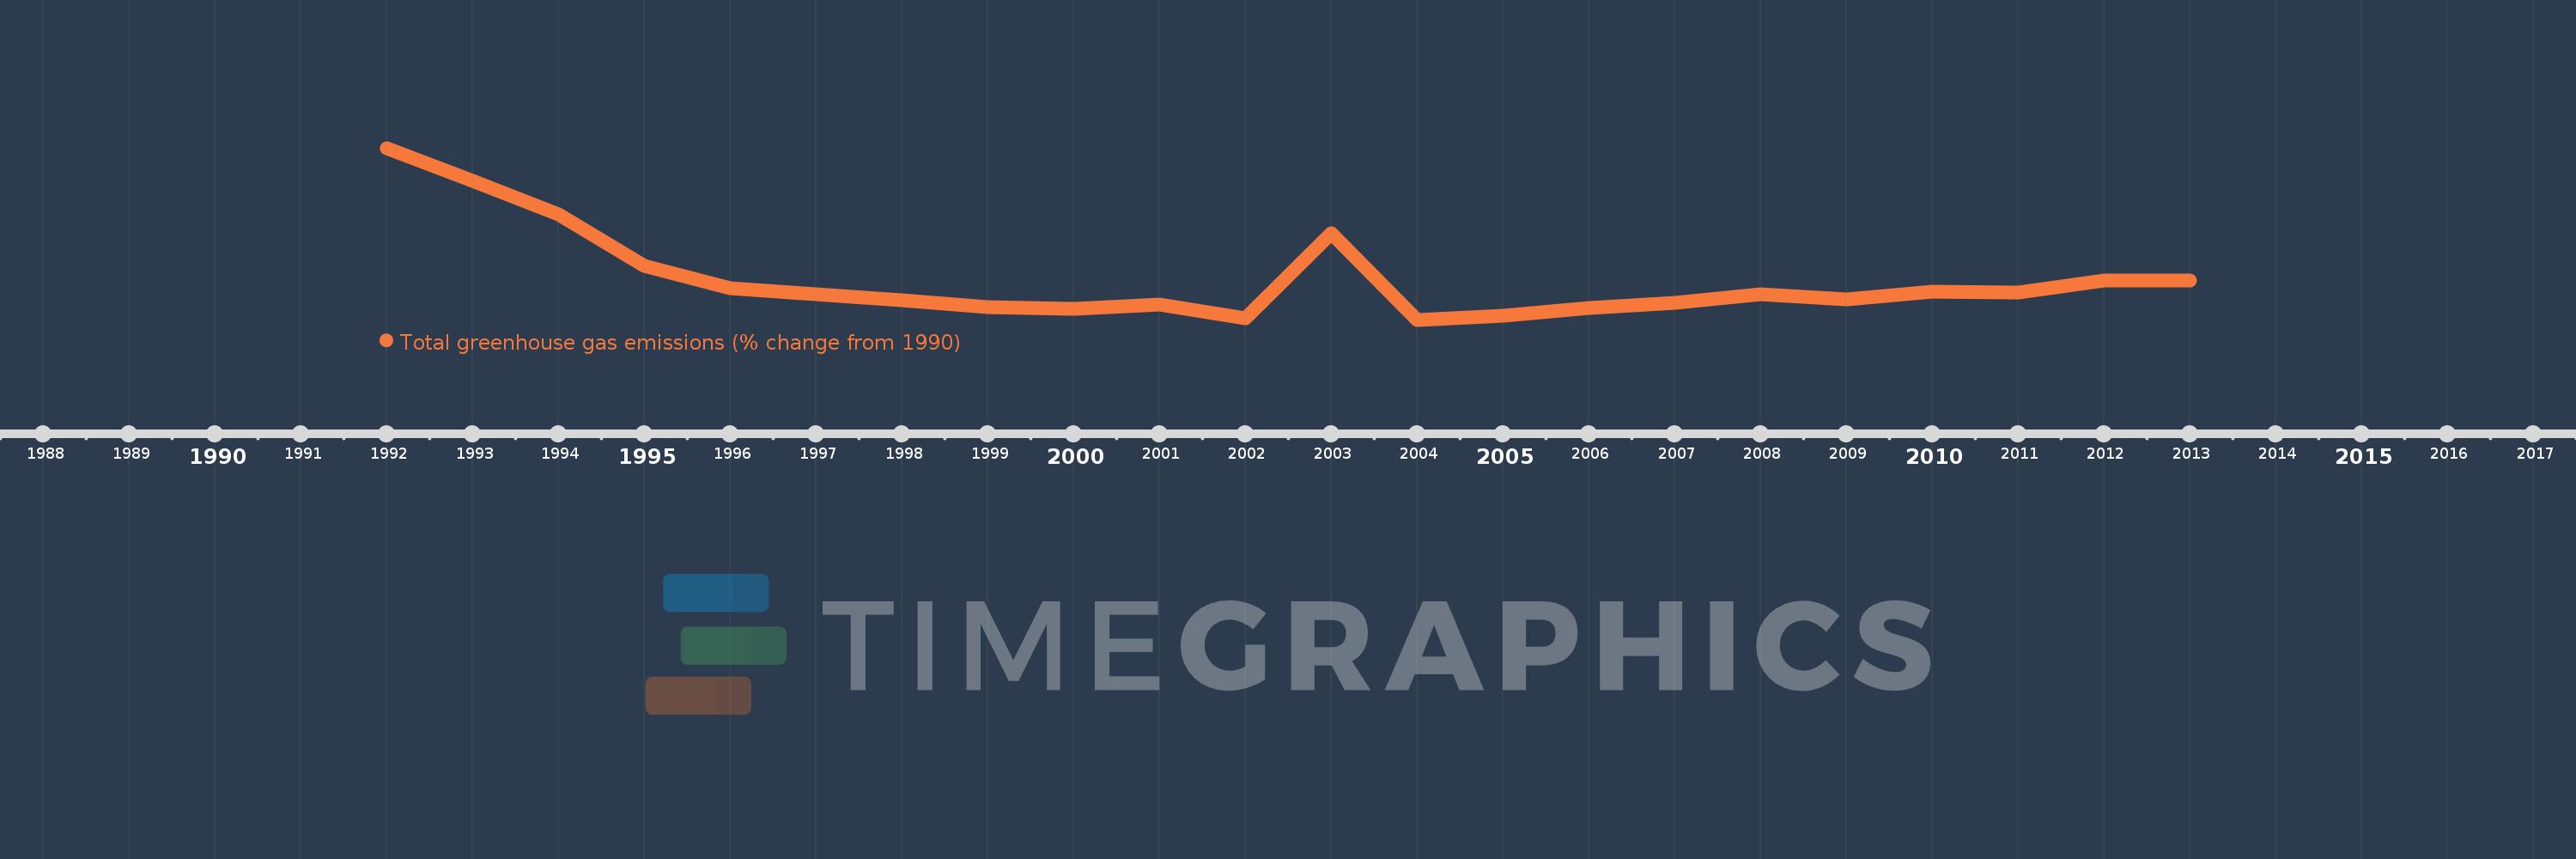
This timeline shows a graph from 1992 to 2013 of Georgia. No data until 1991. Number of actual observations by date: 22.
Source name:
World Development Indicators
Source organization:
World Bank staff estimates from original source: European Commission, Joint Research Centre (JRC)/Netherlands Environmental Assessment Agency (PBL). Emission Database for Global Atmospheric Research (EDGAR): http://edgar.jrc.ec.europa.eu/.
Categories, topics:
Climate Change, Environment
Last updated:
apr 23, 2017
Indicators value changes by year
Meaning:
-61.378
Minimum:
-74.743
jan 1, 2004
Maximum:
-17.786
jan 1, 1992
At the date of observation
Value
Absolute change
Change from the previous value
jan 1, 1992
-17.786
-17.786
0.0%
jan 1, 1993
-28.553
-10.766
60.53%
jan 1, 1994
-39.783
-11.231
39.33%
jan 1, 1995
-56.848
-17.065
42.89%
jan 1, 1996
-64.375
-7.527
13.24%
jan 1, 1997
-66.166
-1.792
2.78%
jan 1, 1998
-68.402
-2.236
3.38%
jan 1, 1999
-70.579
-2.177
3.18%
jan 1, 2000
-71.266
-0.687
0.97%
jan 1, 2001
-69.769
+1.496
-2.1%
jan 1, 2002
-74.39
-4.621
6.62%
jan 1, 2003
-45.978
+28.412
-38.19%
jan 1, 2004
-74.743
-28.765
62.56%
jan 1, 2005
-73.395
+1.348
-1.8%
jan 1, 2006
-70.722
+2.673
-3.64%
jan 1, 2007
-69.021
+1.701
-2.4%
jan 1, 2008
-66.288
+2.733
-3.96%
jan 1, 2009
-67.865
-1.577
2.38%
jan 1, 2010
-65.333
+2.533
-3.73%
jan 1, 2011
-65.703
-0.37
0.57%
jan 1, 2012
-61.629
+4.074
-6.2%
jan 1, 2013
-61.728
-0.1
0.16%
Ranking of countries by current statistics by years