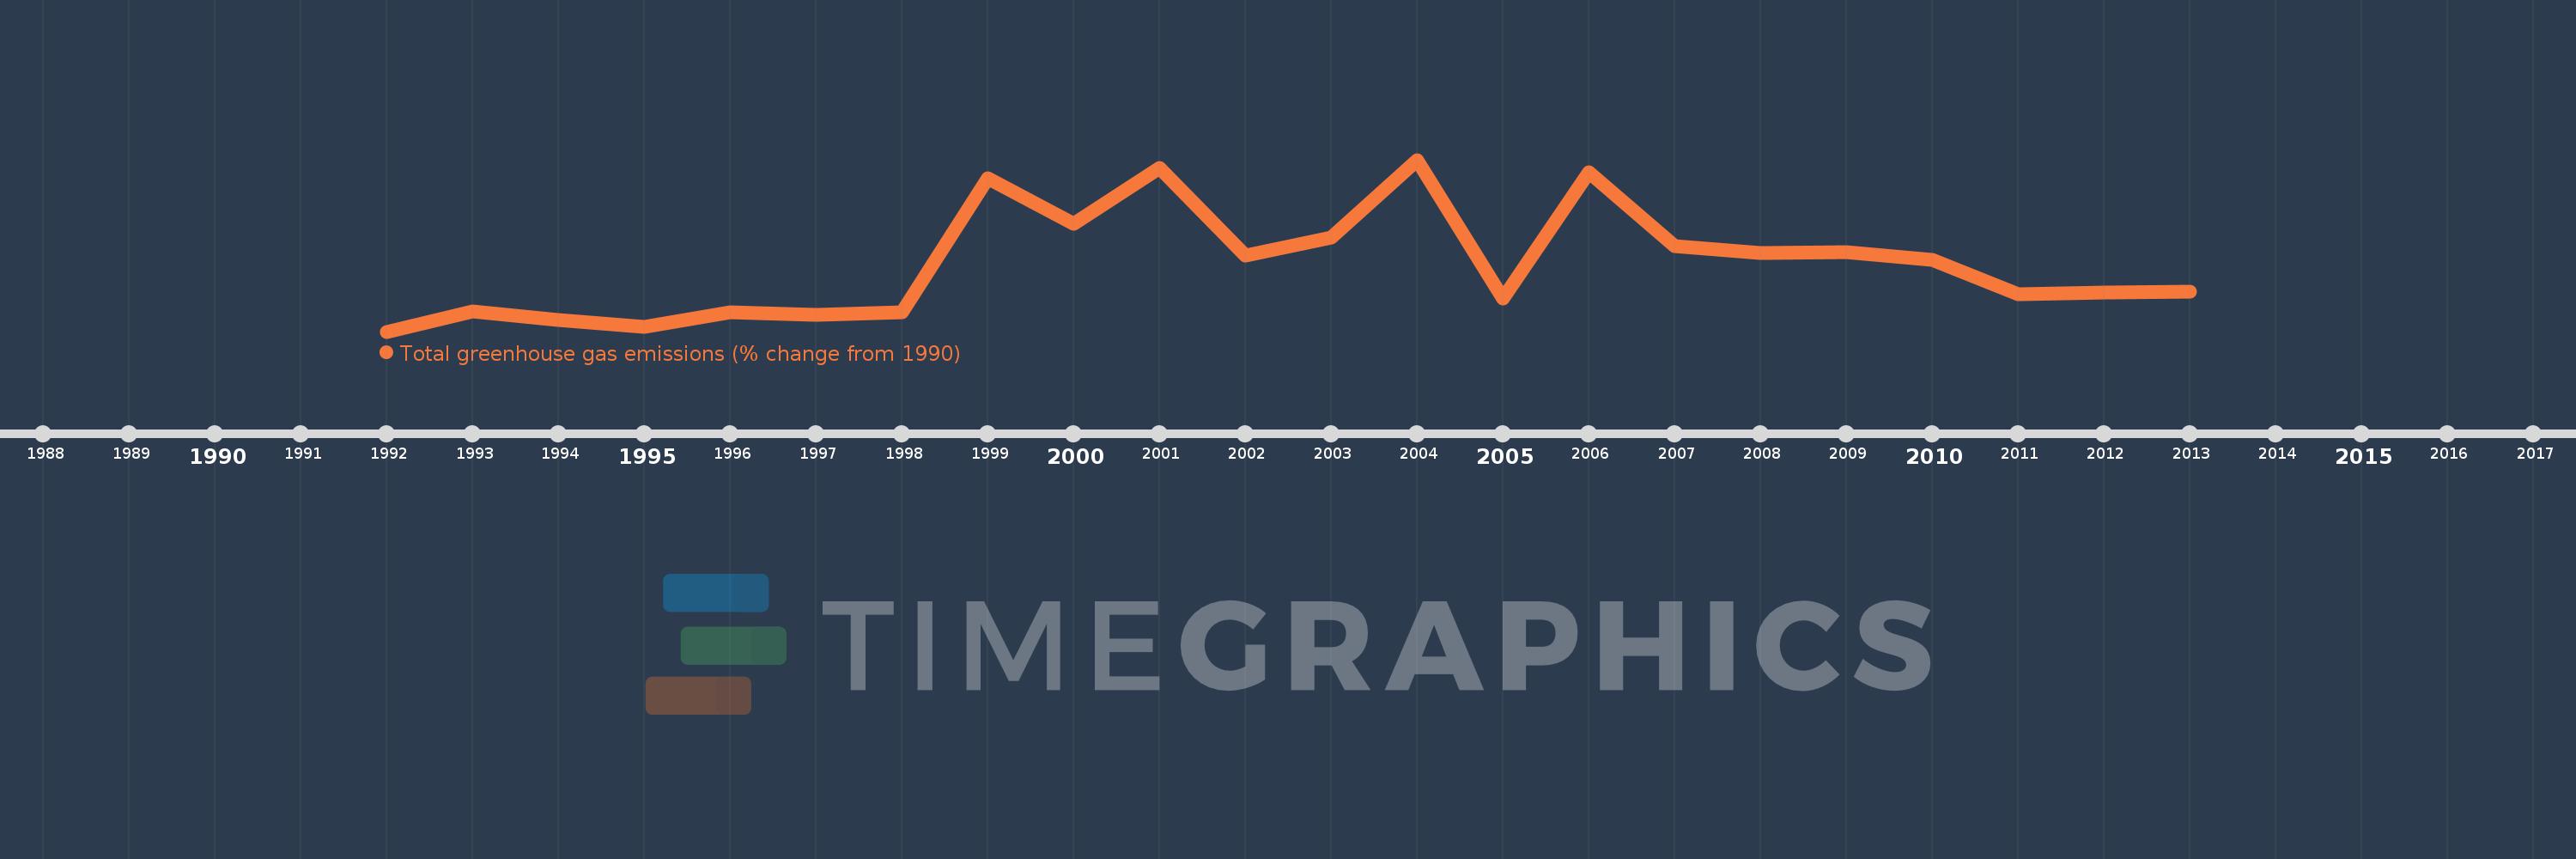
This timeline shows a graph from 1992 to 2013 of Cameroon. No data until 1991. Number of actual observations by date: 22.
Source name:
World Development Indicators
Source organization:
World Bank staff estimates from original source: European Commission, Joint Research Centre (JRC)/Netherlands Environmental Assessment Agency (PBL). Emission Database for Global Atmospheric Research (EDGAR): http://edgar.jrc.ec.europa.eu/.
Categories, topics:
Climate Change, Environment
Last updated:
apr 23, 2017
Indicators value changes by year
Meaning:
17.596
Minimum:
-17.071
jan 1, 1992
Maximum:
71.196
jan 1, 2004
At the date of observation
Value
Absolute change
Change from the previous value
jan 1, 1992
-17.071
-17.071
0.0%
jan 1, 1993
-6.507
+10.564
-61.88%
jan 1, 1994
-11.137
-4.63
71.15%
jan 1, 1995
-14.7
-3.563
31.99%
jan 1, 1996
-6.958
+7.742
-52.67%
jan 1, 1997
-8.566
-1.608
23.11%
jan 1, 1998
-6.94
+1.625
-18.98%
jan 1, 1999
61.681
+68.621
-988.74%
jan 1, 2000
38.127
-23.554
-38.19%
jan 1, 2001
67.189
+29.062
76.23%
jan 1, 2002
21.927
-45.263
-67.37%
jan 1, 2003
31.457
+9.53
43.46%
jan 1, 2004
71.196
+39.739
126.33%
jan 1, 2005
0.032
-71.164
-99.96%
jan 1, 2006
64.757
+64.725
204.42K%
jan 1, 2007
26.993
-37.764
-58.32%
jan 1, 2008
23.348
-3.645
-13.5%
jan 1, 2009
23.948
+0.6
2.57%
jan 1, 2010
19.665
-4.283
-17.88%
jan 1, 2011
2.325
-17.34
-88.18%
jan 1, 2012
2.903
+0.577
24.83%
jan 1, 2013
3.452
+0.549
18.91%
Ranking of countries by current statistics by years