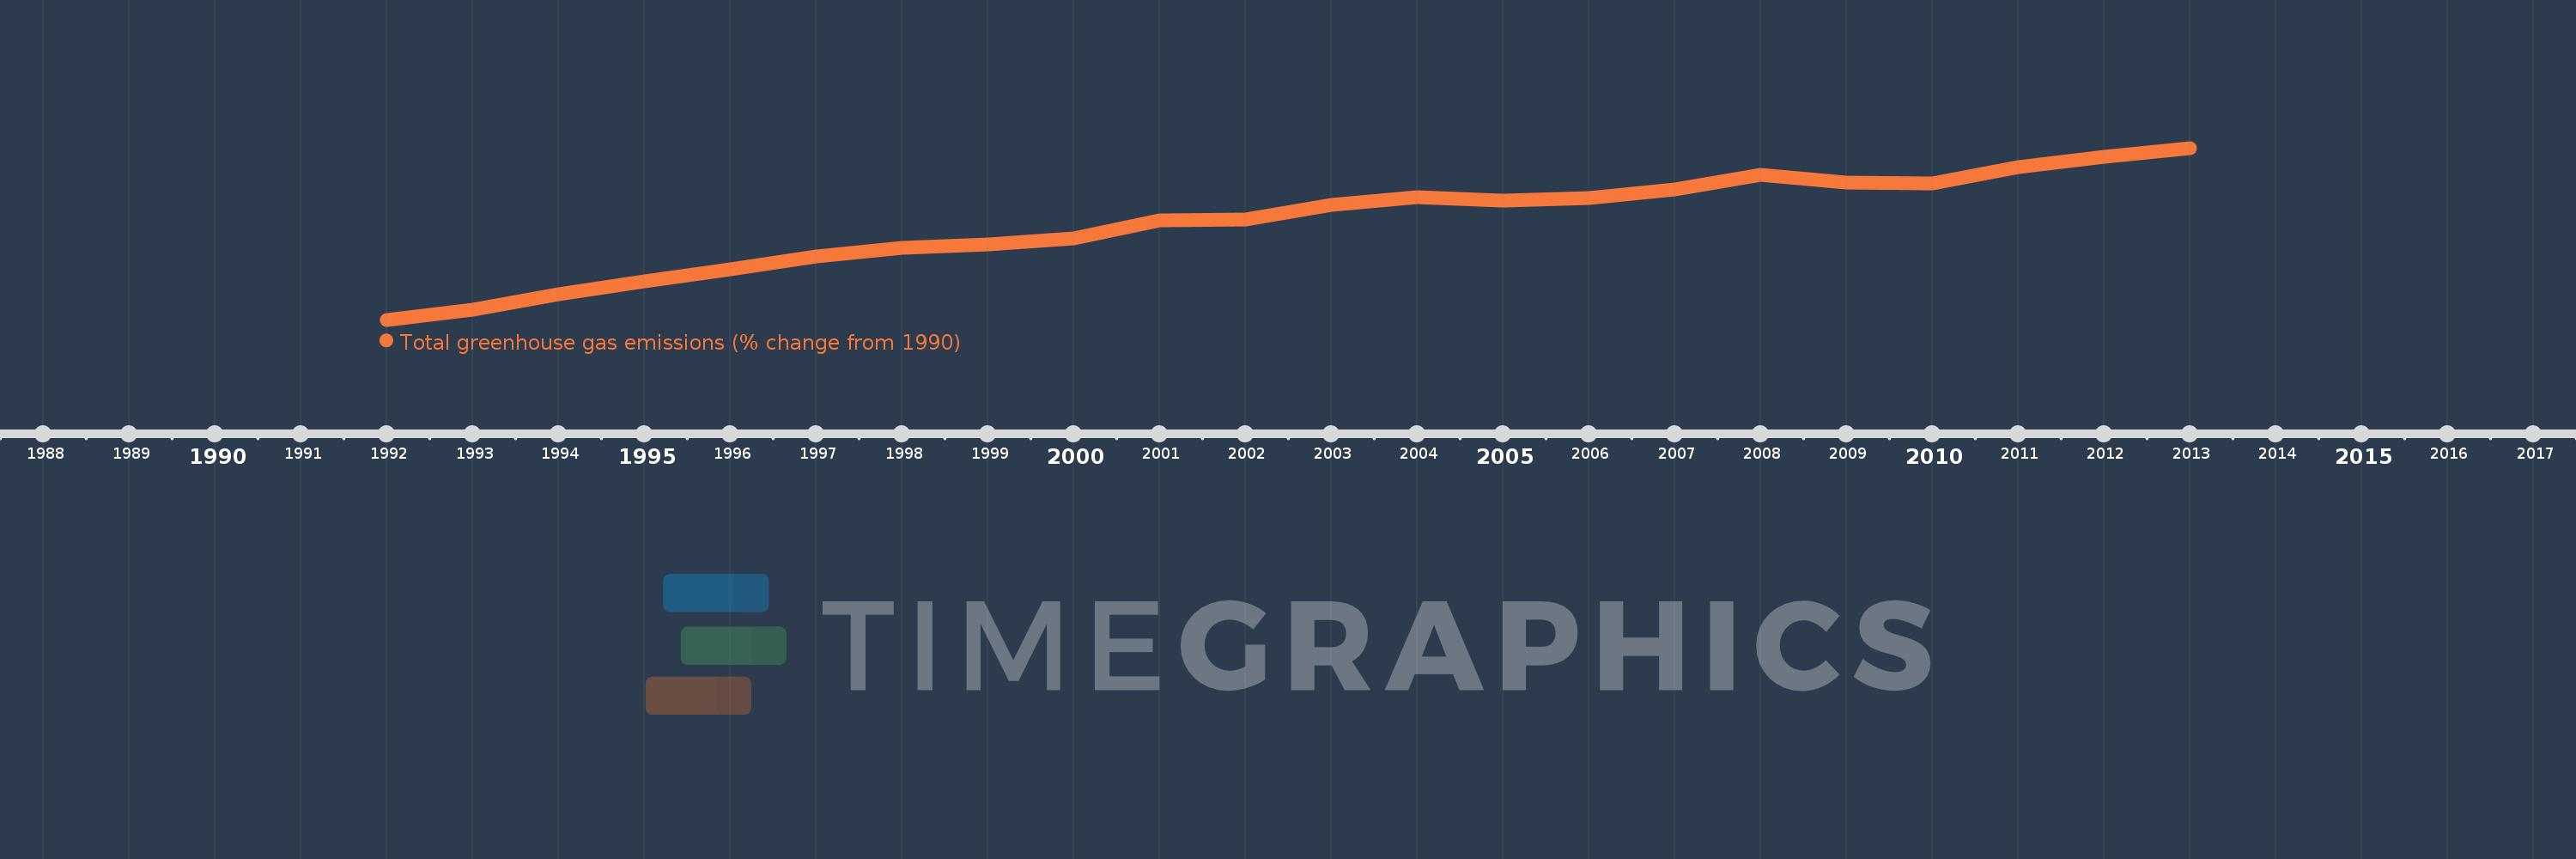
This timeline shows a graph from 1992 to 2013 of Israel. No data until 1991. Number of actual observations by date: 22.
Source name:
World Development Indicators
Source organization:
World Bank staff estimates from original source: European Commission, Joint Research Centre (JRC)/Netherlands Environmental Assessment Agency (PBL). Emission Database for Global Atmospheric Research (EDGAR): http://edgar.jrc.ec.europa.eu/.
Categories, topics:
Climate Change, Environment
Last updated:
apr 23, 2017
Indicators value changes by year
Meaning:
64.022
Minimum:
1.779
jan 1, 1992
Maximum:
112.183
jan 1, 2013
At the date of observation
Value
Absolute change
Change from the previous value
jan 1, 1992
1.779
+1.779
0.0%
jan 1, 1993
8.44
+6.661
374.46%
jan 1, 1994
17.995
+9.554
113.2%
jan 1, 1995
26.394
+8.399
46.67%
jan 1, 1996
34.451
+8.057
30.53%
jan 1, 1997
42.695
+8.244
23.93%
jan 1, 1998
48.049
+5.354
12.54%
jan 1, 1999
50.356
+2.308
4.8%
jan 1, 2000
54.001
+3.644
7.24%
jan 1, 2001
65.666
+11.666
21.6%
jan 1, 2002
66.322
+0.656
1.0%
jan 1, 2003
75.433
+9.111
13.74%
jan 1, 2004
80.598
+5.165
6.85%
jan 1, 2005
78.181
-2.417
-3.0%
jan 1, 2006
80.142
+1.961
2.51%
jan 1, 2007
85.793
+5.651
7.05%
jan 1, 2008
94.723
+8.93
10.41%
jan 1, 2009
89.952
-4.772
-5.04%
jan 1, 2010
89.415
-0.537
-0.6%
jan 1, 2011
99.631
+10.216
11.43%
jan 1, 2012
106.274
+6.644
6.67%
jan 1, 2013
112.183
+5.909
5.56%
Ranking of countries by current statistics by years