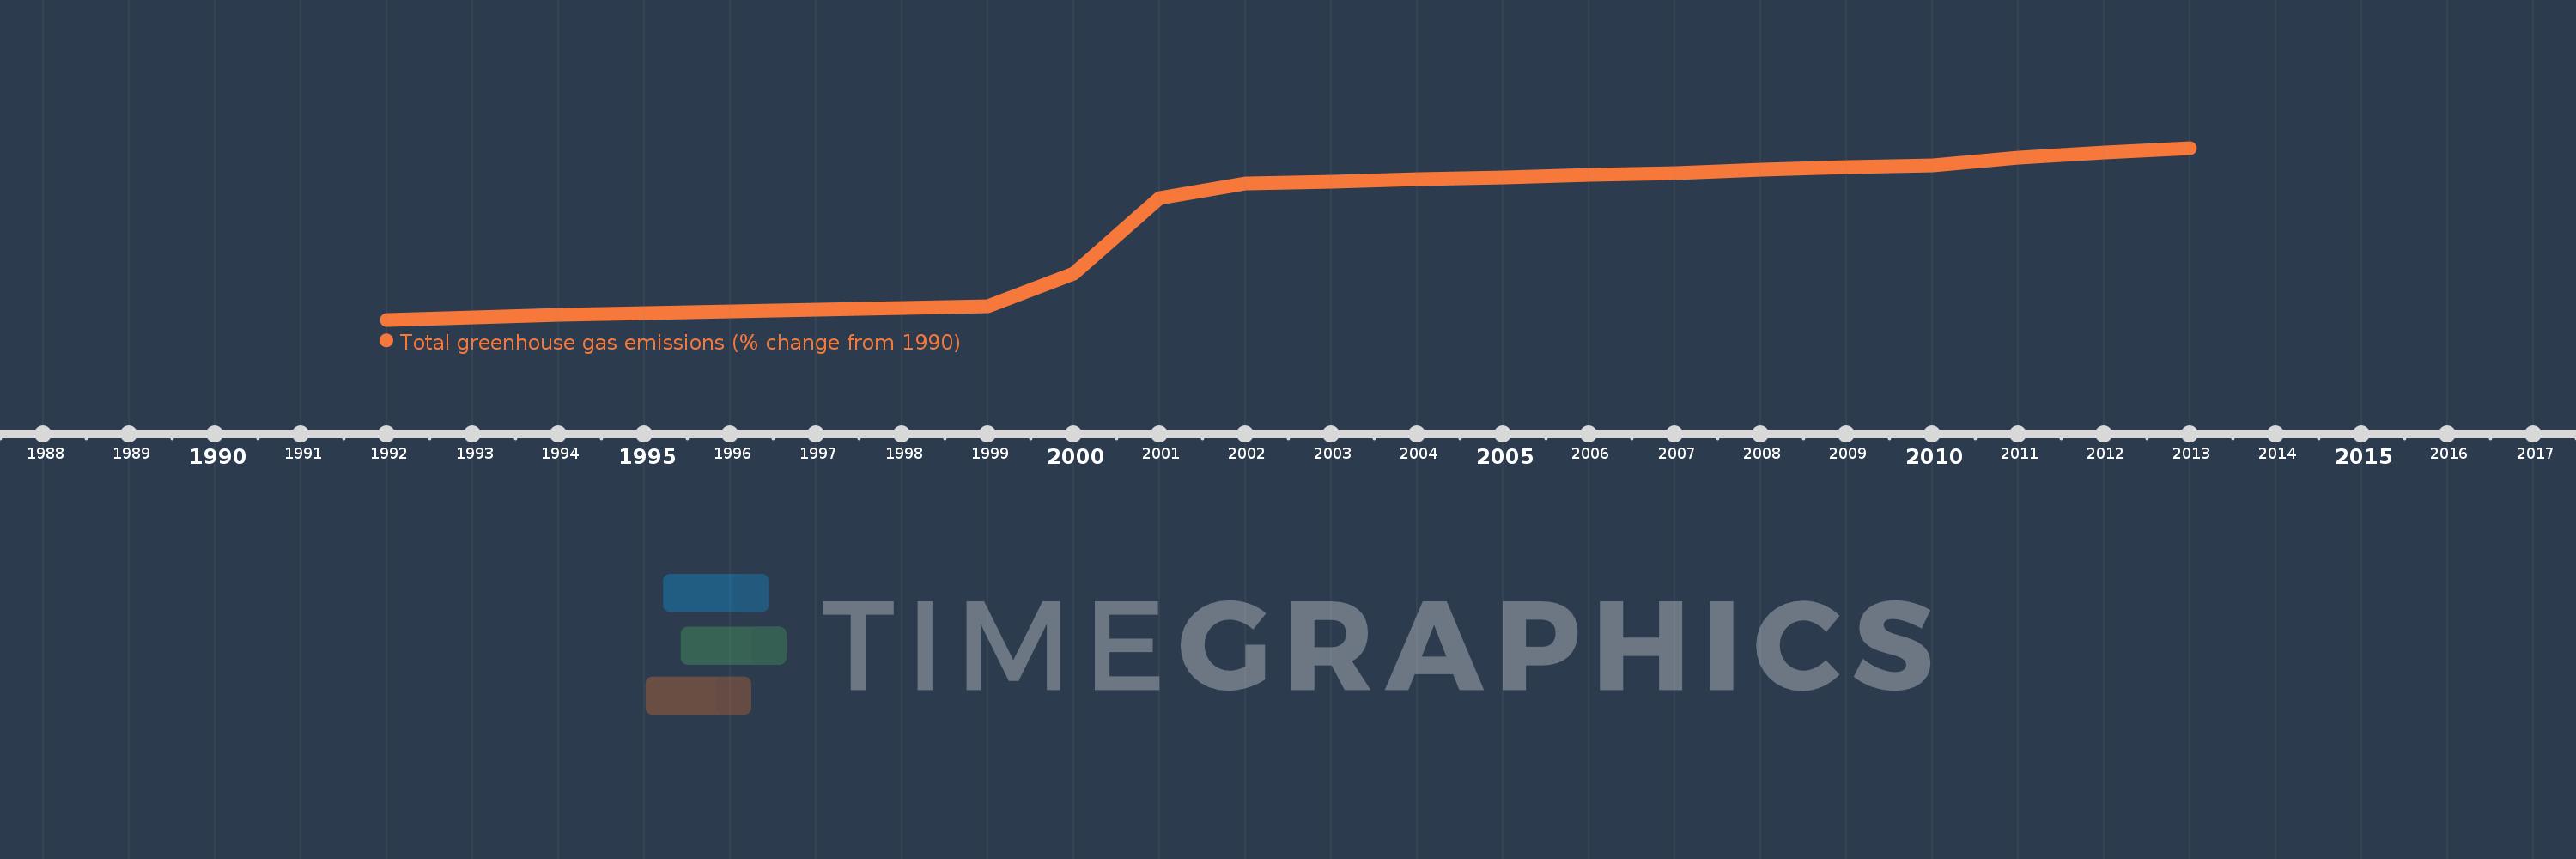
This timeline shows a graph from 1992 to 2013 of American Samoa. No data until 1991. Number of actual observations by date: 22.
Source name:
World Development Indicators
Source organization:
World Bank staff estimates from original source: European Commission, Joint Research Centre (JRC)/Netherlands Environmental Assessment Agency (PBL). Emission Database for Global Atmospheric Research (EDGAR): http://edgar.jrc.ec.europa.eu/.
Categories, topics:
Climate Change, Environment
Last updated:
apr 23, 2017
Indicators value changes by year
Meaning:
102.63
Minimum:
2.873
jan 1, 1992
Maximum:
188.329
jan 1, 2013
At the date of observation
Value
Absolute change
Change from the previous value
jan 1, 1992
2.873
+2.873
0.0%
jan 1, 1993
5.54
+2.666
92.8%
jan 1, 1994
7.936
+2.397
43.26%
jan 1, 1995
10.17
+2.234
28.14%
jan 1, 1996
12.281
+2.111
20.76%
jan 1, 1997
14.139
+1.858
15.13%
jan 1, 1998
15.867
+1.728
12.22%
jan 1, 1999
17.406
+1.539
9.7%
jan 1, 2000
52.765
+35.359
203.14%
jan 1, 2001
133.821
+81.056
153.62%
jan 1, 2002
149.655
+15.834
11.83%
jan 1, 2003
151.937
+2.282
1.52%
jan 1, 2004
154.342
+2.405
1.58%
jan 1, 2005
156.707
+2.365
1.53%
jan 1, 2006
159.066
+2.359
1.51%
jan 1, 2007
161.523
+2.457
1.54%
jan 1, 2008
164.526
+3.002
1.86%
jan 1, 2009
167.972
+3.446
2.09%
jan 1, 2010
169.802
+1.83
1.09%
jan 1, 2011
177.888
+8.086
4.76%
jan 1, 2012
183.315
+5.427
3.05%
jan 1, 2013
188.329
+5.014
2.74%
Ranking of countries by current statistics by years