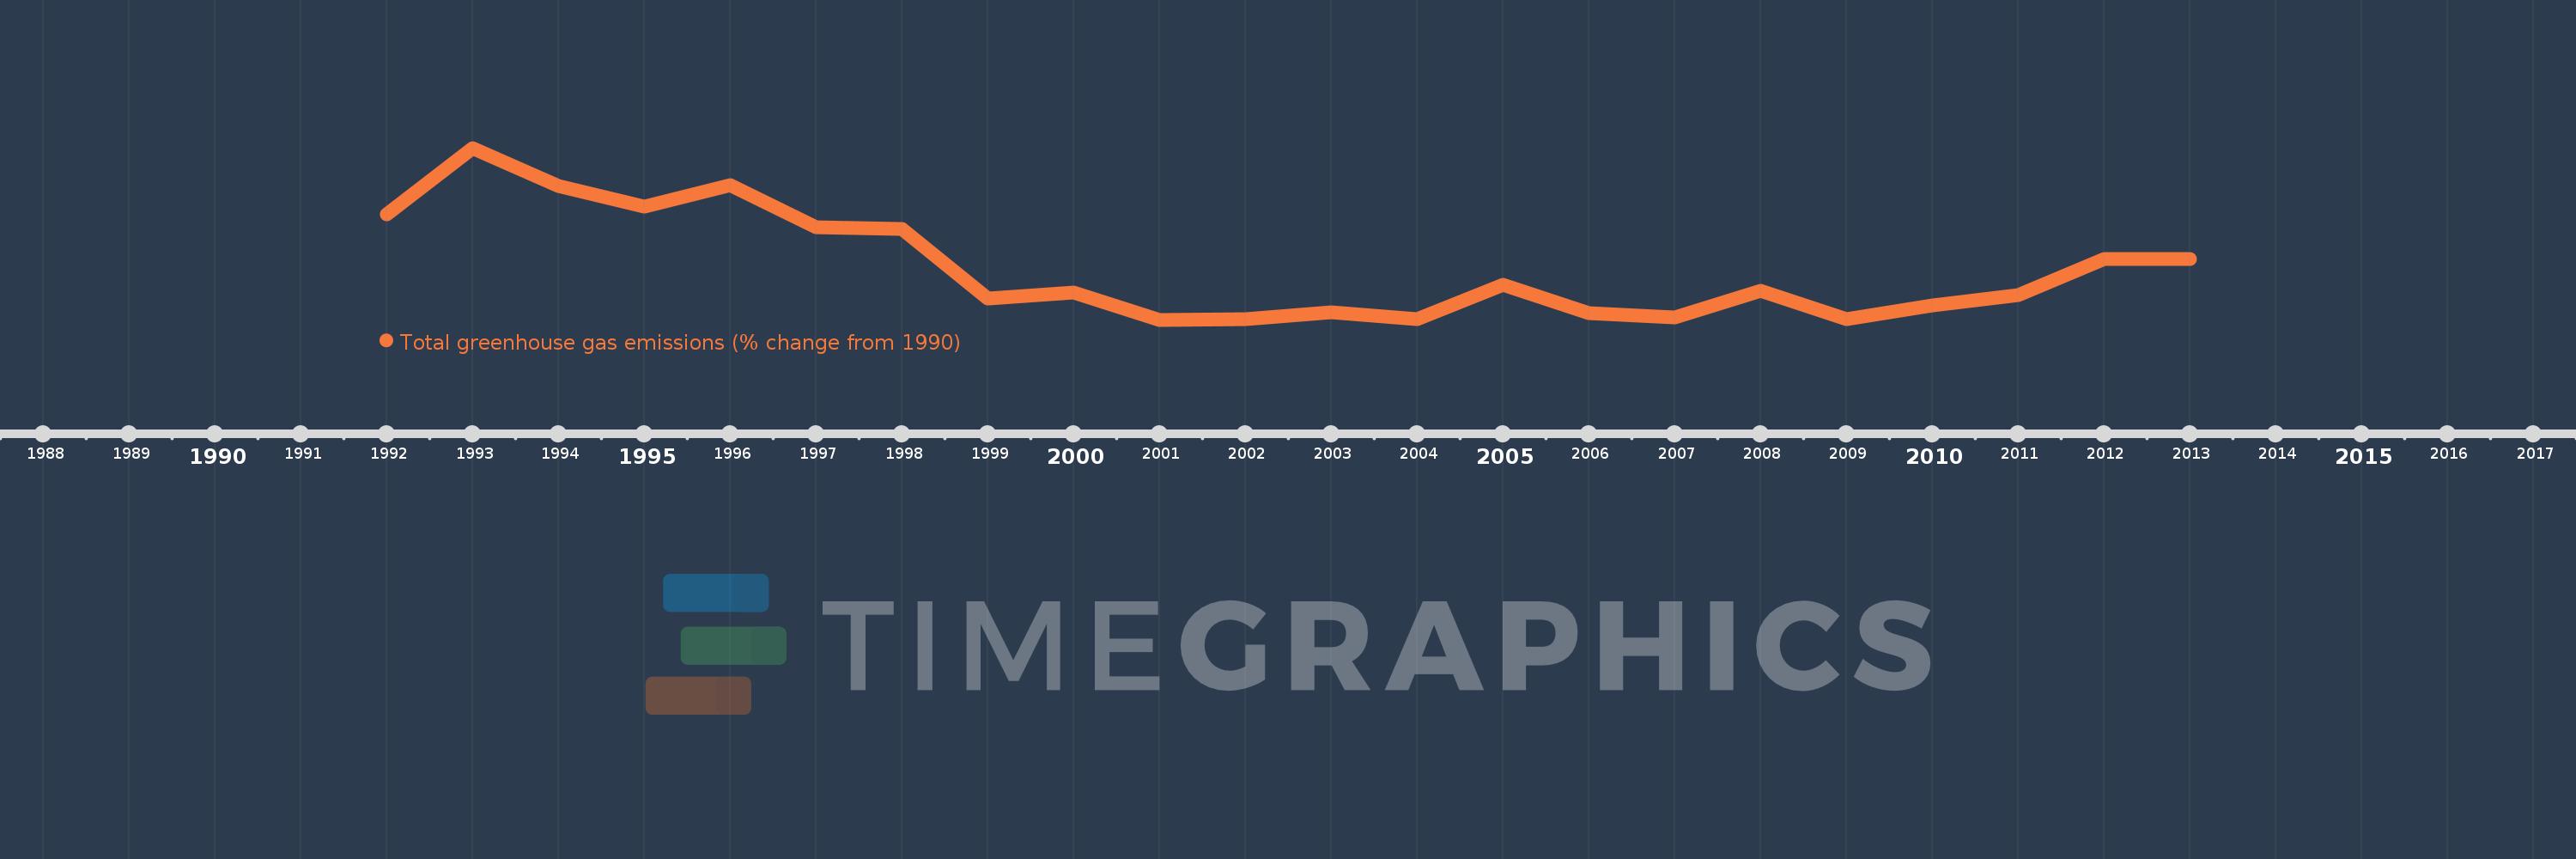
This timeline shows a graph from 1992 to 2013 of Myanmar. No data until 1991. Number of actual observations by date: 22.
Source name:
World Development Indicators
Source organization:
World Bank staff estimates from original source: European Commission, Joint Research Centre (JRC)/Netherlands Environmental Assessment Agency (PBL). Emission Database for Global Atmospheric Research (EDGAR): http://edgar.jrc.ec.europa.eu/.
Categories, topics:
Climate Change, Environment
Last updated:
apr 23, 2017
Indicators value changes by year
Meaning:
-45.747
Minimum:
-78.852
jan 1, 2001
Maximum:
31.524
jan 1, 1993
At the date of observation
Value
Absolute change
Change from the previous value
jan 1, 1992
-11.269
-11.269
0.0%
jan 1, 1993
31.524
+42.794
-379.74%
jan 1, 1994
7.082
-24.443
-77.54%
jan 1, 1995
-6.236
-13.317
-188.05%
jan 1, 1996
7.721
+13.957
-223.82%
jan 1, 1997
-19.508
-27.229
-352.67%
jan 1, 1998
-20.374
-0.865
4.43%
jan 1, 1999
-64.975
-44.602
218.92%
jan 1, 2000
-61.42
+3.555
-5.47%
jan 1, 2001
-78.852
-17.432
28.38%
jan 1, 2002
-78.677
+0.175
-0.22%
jan 1, 2003
-74.151
+4.526
-5.75%
jan 1, 2004
-78.599
-4.448
6.0%
jan 1, 2005
-56.604
+21.996
-27.98%
jan 1, 2006
-74.526
-17.922
31.66%
jan 1, 2007
-77.236
-2.71
3.64%
jan 1, 2008
-60.027
+17.209
-22.28%
jan 1, 2009
-78.411
-18.383
30.63%
jan 1, 2010
-69.615
+8.796
-11.22%
jan 1, 2011
-62.834
+6.781
-9.74%
jan 1, 2012
-39.811
+23.023
-36.64%
jan 1, 2013
-39.64
+0.171
-0.43%
Ranking of countries by current statistics by years