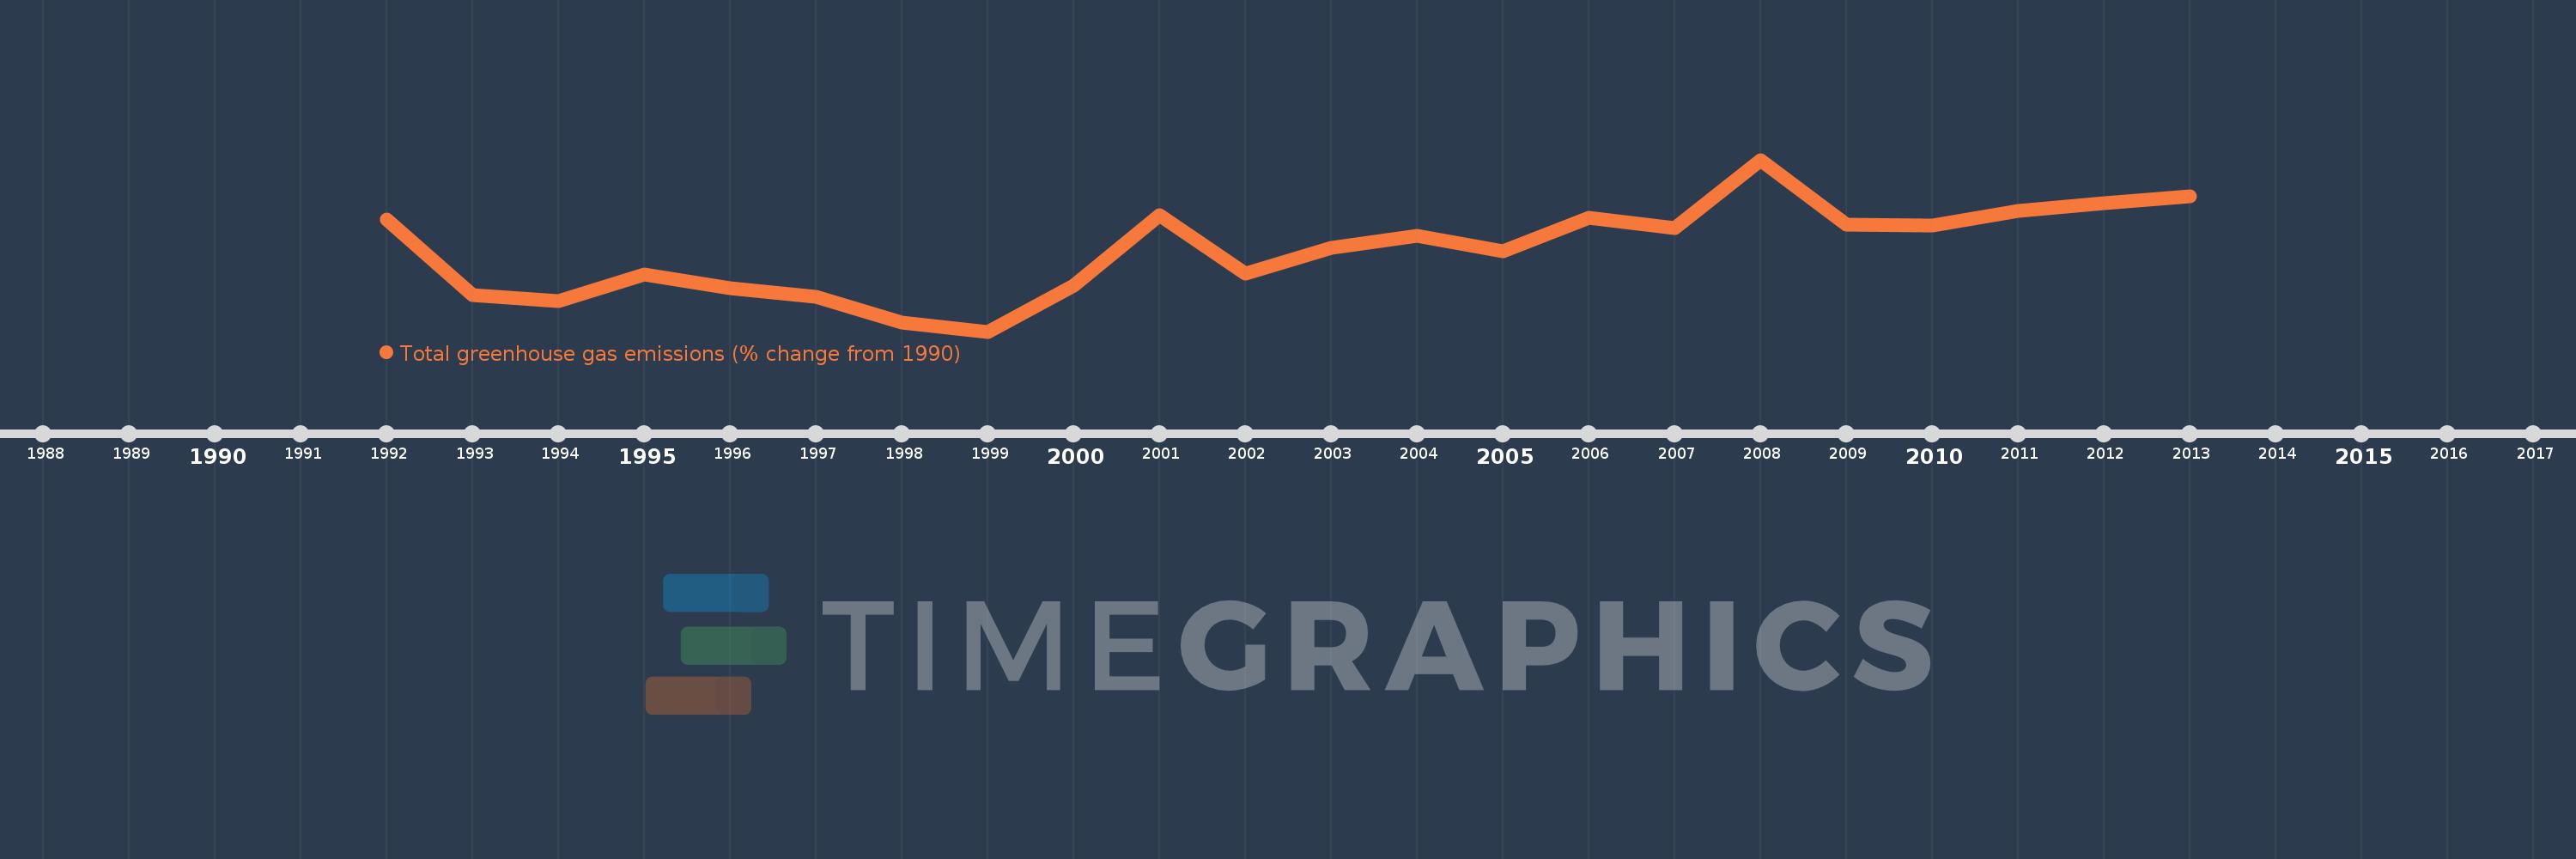
This timeline shows a graph from 1992 to 2013 of Albania. No data until 1991. Number of actual observations by date: 22.
Source name:
World Development Indicators
Source organization:
World Bank staff estimates from original source: European Commission, Joint Research Centre (JRC)/Netherlands Environmental Assessment Agency (PBL). Emission Database for Global Atmospheric Research (EDGAR): http://edgar.jrc.ec.europa.eu/.
Categories, topics:
Climate Change, Environment
Last updated:
apr 23, 2017
Indicators value changes by year
Meaning:
-33.026
Minimum:
-52.792
jan 1, 1999
Maximum:
-11.098
jan 1, 2008
At the date of observation
Value
Absolute change
Change from the previous value
jan 1, 1992
-25.548
-25.548
0.0%
jan 1, 1993
-43.964
-18.416
72.08%
jan 1, 1994
-45.403
-1.44
3.27%
jan 1, 1995
-38.865
+6.539
-14.4%
jan 1, 1996
-42.214
-3.35
8.62%
jan 1, 1997
-44.322
-2.107
4.99%
jan 1, 1998
-50.502
-6.18
13.94%
jan 1, 1999
-52.792
-2.29
4.53%
jan 1, 2000
-41.567
+11.225
-21.26%
jan 1, 2001
-24.508
+17.06
-41.04%
jan 1, 2002
-38.623
-14.116
57.6%
jan 1, 2003
-32.482
+6.141
-15.9%
jan 1, 2004
-29.504
+2.978
-9.17%
jan 1, 2005
-33.4
-3.896
13.2%
jan 1, 2006
-25.235
+8.164
-24.44%
jan 1, 2007
-27.766
-2.531
10.03%
jan 1, 2008
-11.098
+16.668
-60.03%
jan 1, 2009
-26.78
-15.681
141.29%
jan 1, 2010
-27.031
-0.252
0.94%
jan 1, 2011
-23.448
+3.583
-13.26%
jan 1, 2012
-21.601
+1.847
-7.88%
jan 1, 2013
-19.924
+1.677
-7.76%
Ranking of countries by current statistics by years