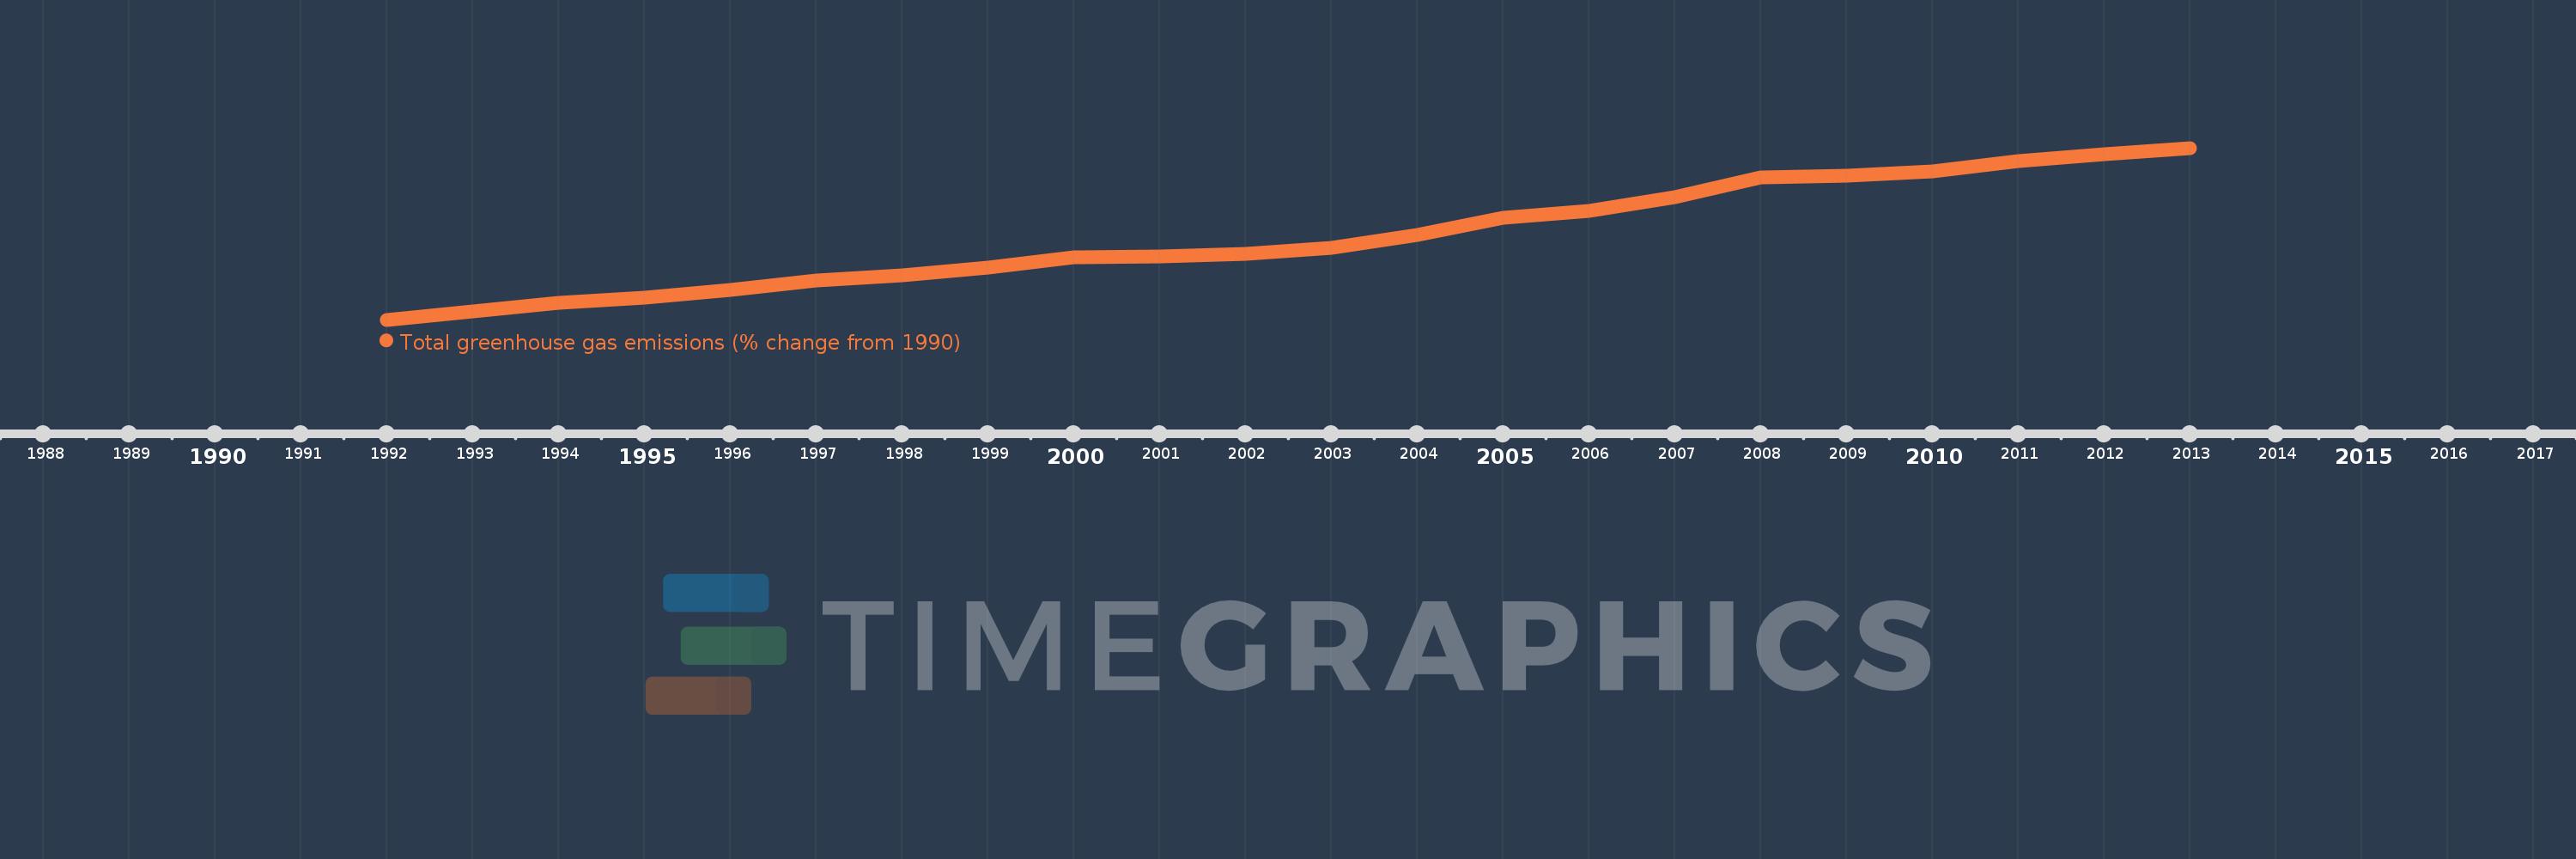
This timeline shows a graph from 1992 to 2013 of Pakistan. No data until 1991. Number of actual observations by date: 22.
Source name:
World Development Indicators
Source organization:
World Bank staff estimates from original source: European Commission, Joint Research Centre (JRC)/Netherlands Environmental Assessment Agency (PBL). Emission Database for Global Atmospheric Research (EDGAR): http://edgar.jrc.ec.europa.eu/.
Categories, topics:
Climate Change, Environment
Last updated:
apr 23, 2017
Indicators value changes by year
Meaning:
56.185
Minimum:
1.976
jan 1, 1992
Maximum:
114.275
jan 1, 2013
At the date of observation
Value
Absolute change
Change from the previous value
jan 1, 1992
1.976
+1.976
0.0%
jan 1, 1993
7.327
+5.351
270.84%
jan 1, 1994
12.919
+5.592
76.32%
jan 1, 1995
16.524
+3.605
27.9%
jan 1, 1996
21.268
+4.745
28.71%
jan 1, 1997
27.545
+6.277
29.51%
jan 1, 1998
30.921
+3.376
12.26%
jan 1, 1999
35.79
+4.869
15.75%
jan 1, 2000
42.921
+7.131
19.92%
jan 1, 2001
43.348
+0.427
0.99%
jan 1, 2002
45.223
+1.875
4.33%
jan 1, 2003
48.915
+3.691
8.16%
jan 1, 2004
57.411
+8.497
17.37%
jan 1, 2005
68.654
+11.242
19.58%
jan 1, 2006
73.36
+4.706
6.86%
jan 1, 2007
82.064
+8.705
11.87%
jan 1, 2008
94.962
+12.898
15.72%
jan 1, 2009
96.204
+1.241
1.31%
jan 1, 2010
98.923
+2.719
2.83%
jan 1, 2011
105.463
+6.54
6.61%
jan 1, 2012
110.068
+4.605
4.37%
jan 1, 2013
114.275
+4.207
3.82%
Ranking of countries by current statistics by years