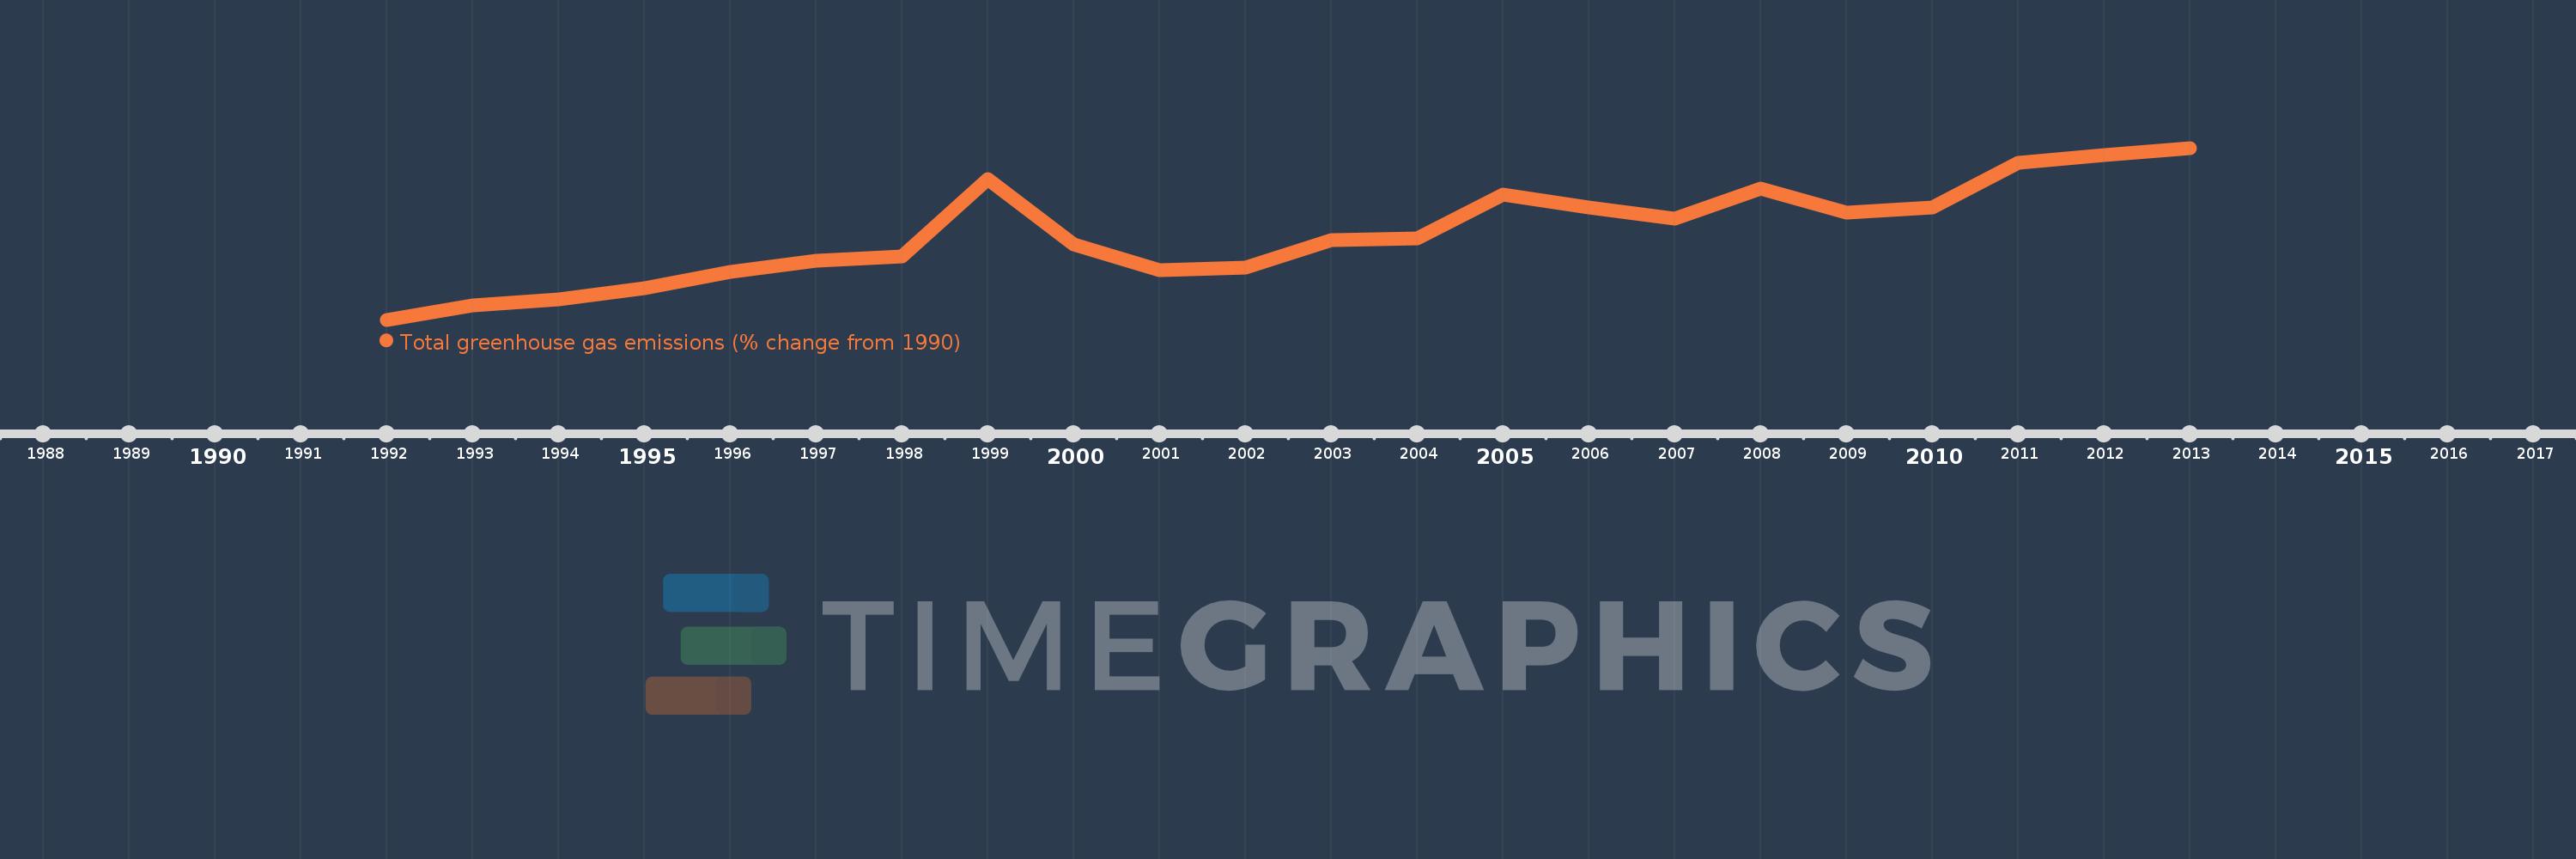
This timeline shows a graph from 1992 to 2013 of Thailand. No data until 1991. Number of actual observations by date: 22.
Source name:
World Development Indicators
Source organization:
World Bank staff estimates from original source: European Commission, Joint Research Centre (JRC)/Netherlands Environmental Assessment Agency (PBL). Emission Database for Global Atmospheric Research (EDGAR): http://edgar.jrc.ec.europa.eu/.
Categories, topics:
Climate Change, Environment
Last updated:
apr 23, 2017
Indicators value changes by year
Meaning:
58.927
Minimum:
5.633
jan 1, 1992
Maximum:
111.672
jan 1, 2013
At the date of observation
Value
Absolute change
Change from the previous value
jan 1, 1992
5.633
+5.633
0.0%
jan 1, 1993
14.625
+8.992
159.64%
jan 1, 1994
18.165
+3.54
24.21%
jan 1, 1995
25.109
+6.944
38.23%
jan 1, 1996
35.355
+10.247
40.81%
jan 1, 1997
42.067
+6.712
18.98%
jan 1, 1998
44.55
+2.483
5.9%
jan 1, 1999
92.473
+47.923
107.57%
jan 1, 2000
52.16
-40.312
-43.59%
jan 1, 2001
36.435
-15.726
-30.15%
jan 1, 2002
38.062
+1.627
4.47%
jan 1, 2003
54.979
+16.917
44.45%
jan 1, 2004
55.815
+0.836
1.52%
jan 1, 2005
82.719
+26.905
48.2%
jan 1, 2006
75.099
-7.621
-9.21%
jan 1, 2007
68.209
-6.89
-9.17%
jan 1, 2008
86.755
+18.546
27.19%
jan 1, 2009
71.923
-14.832
-17.1%
jan 1, 2010
74.842
+2.919
4.06%
jan 1, 2011
102.452
+27.61
36.89%
jan 1, 2012
107.299
+4.847
4.73%
jan 1, 2013
111.672
+4.373
4.08%
Ranking of countries by current statistics by years