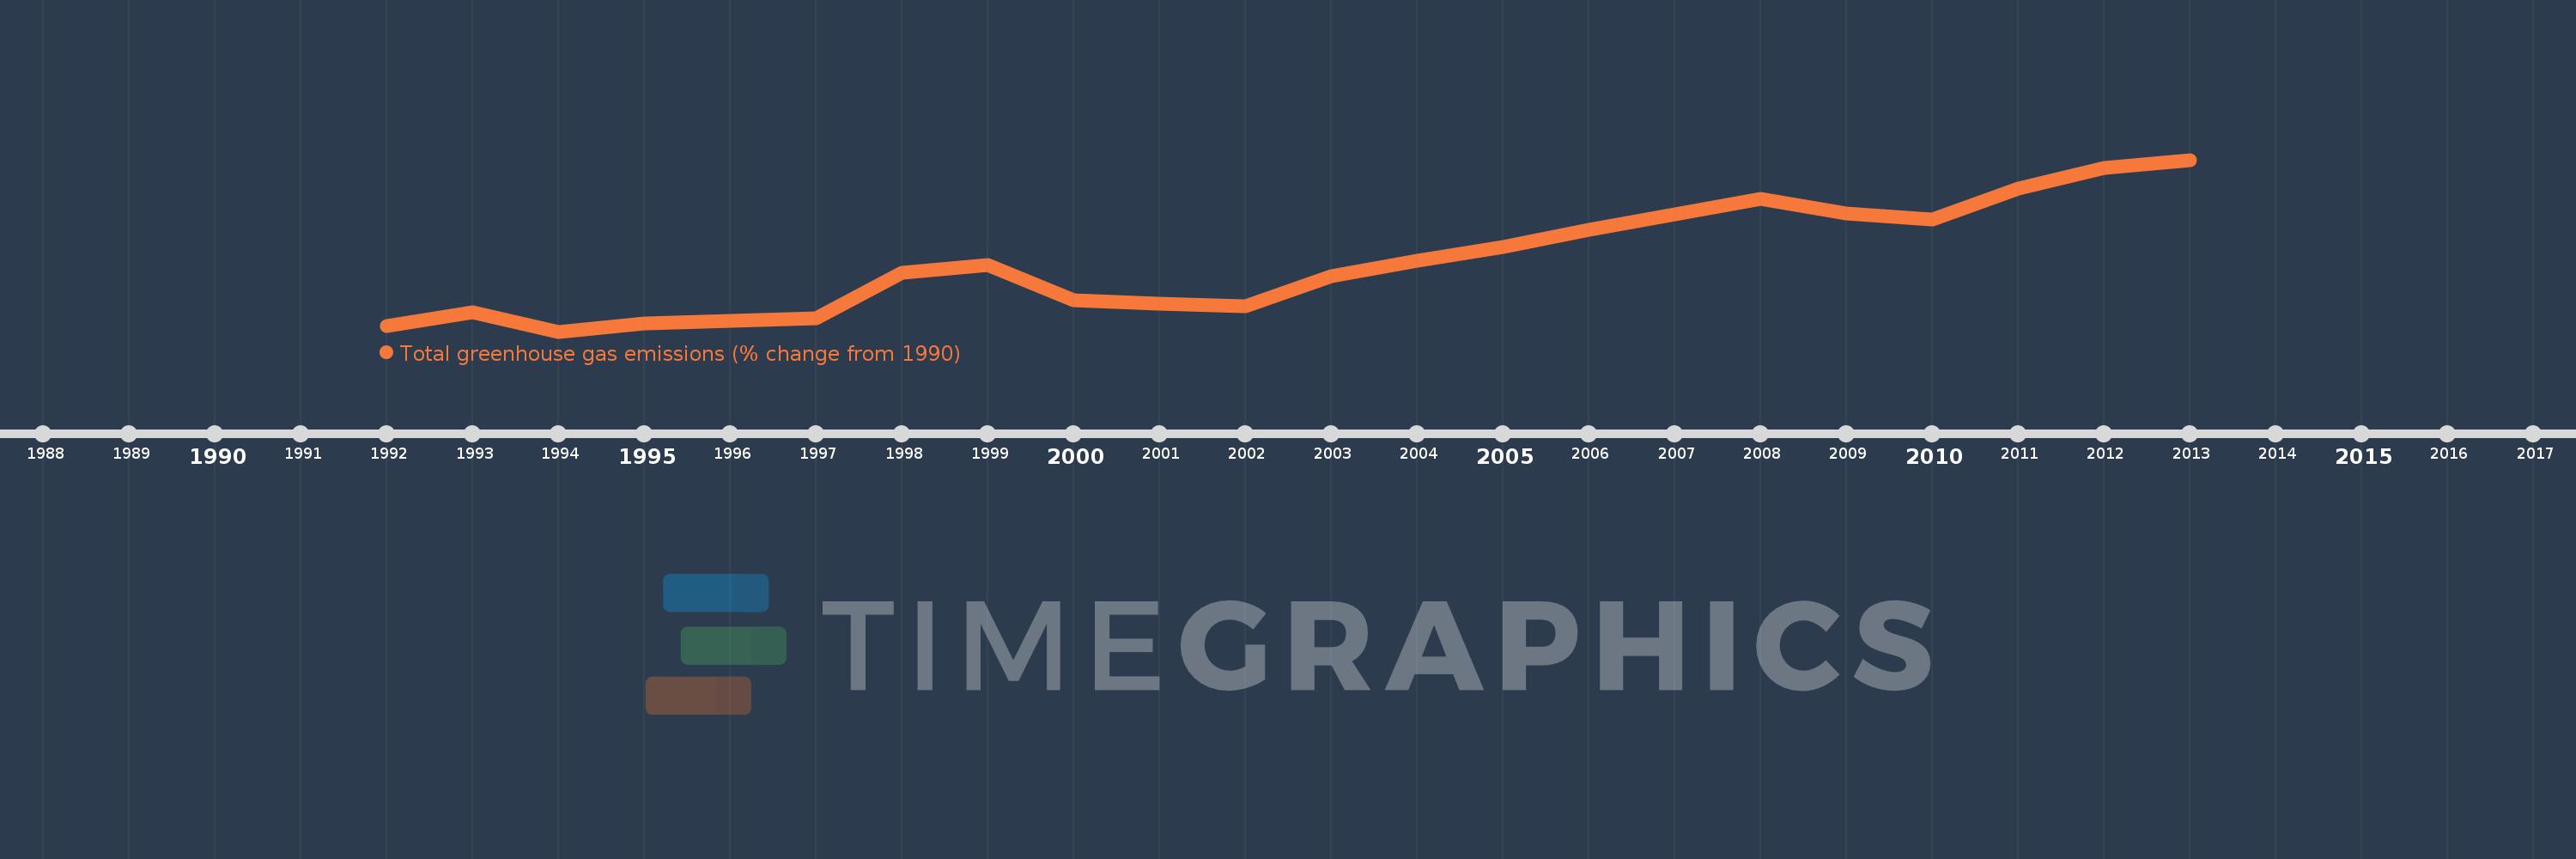
This timeline shows a graph from 1992 to 2013 of World. No data until 1991. Number of actual observations by date: 22.
Source name:
World Development Indicators
Source organization:
World Bank staff estimates from original source: European Commission, Joint Research Centre (JRC)/Netherlands Environmental Assessment Agency (PBL). Emission Database for Global Atmospheric Research (EDGAR): http://edgar.jrc.ec.europa.eu/.
Categories, topics:
Climate Change, Environment
Last updated:
apr 23, 2017
Indicators value changes by year
Meaning:
16.023
Minimum:
-0.394
jan 1, 1994
Maximum:
40.003
jan 1, 2013
At the date of observation
Value
Absolute change
Change from the previous value
jan 1, 1992
0.929
+0.929
0.0%
jan 1, 1993
4.165
+3.235
348.08%
jan 1, 1994
-0.394
-4.559
-109.47%
jan 1, 1995
1.512
+1.907
-483.38%
jan 1, 1996
2.114
+0.602
39.79%
jan 1, 1997
2.685
+0.571
27.0%
jan 1, 1998
13.452
+10.768
401.09%
jan 1, 1999
15.213
+1.76
13.09%
jan 1, 2000
6.957
-8.256
-54.27%
jan 1, 2001
6.098
-0.859
-12.35%
jan 1, 2002
5.58
-0.517
-8.48%
jan 1, 2003
12.655
+7.075
126.78%
jan 1, 2004
16.191
+3.536
27.94%
jan 1, 2005
19.425
+3.234
19.98%
jan 1, 2006
23.498
+4.073
20.97%
jan 1, 2007
27.223
+3.724
15.85%
jan 1, 2008
30.721
+3.498
12.85%
jan 1, 2009
27.287
-3.434
-11.18%
jan 1, 2010
25.943
-1.344
-4.93%
jan 1, 2011
33.163
+7.22
27.83%
jan 1, 2012
38.079
+4.916
14.82%
jan 1, 2013
40.003
+1.924
5.05%
Ranking of countries by current statistics by years