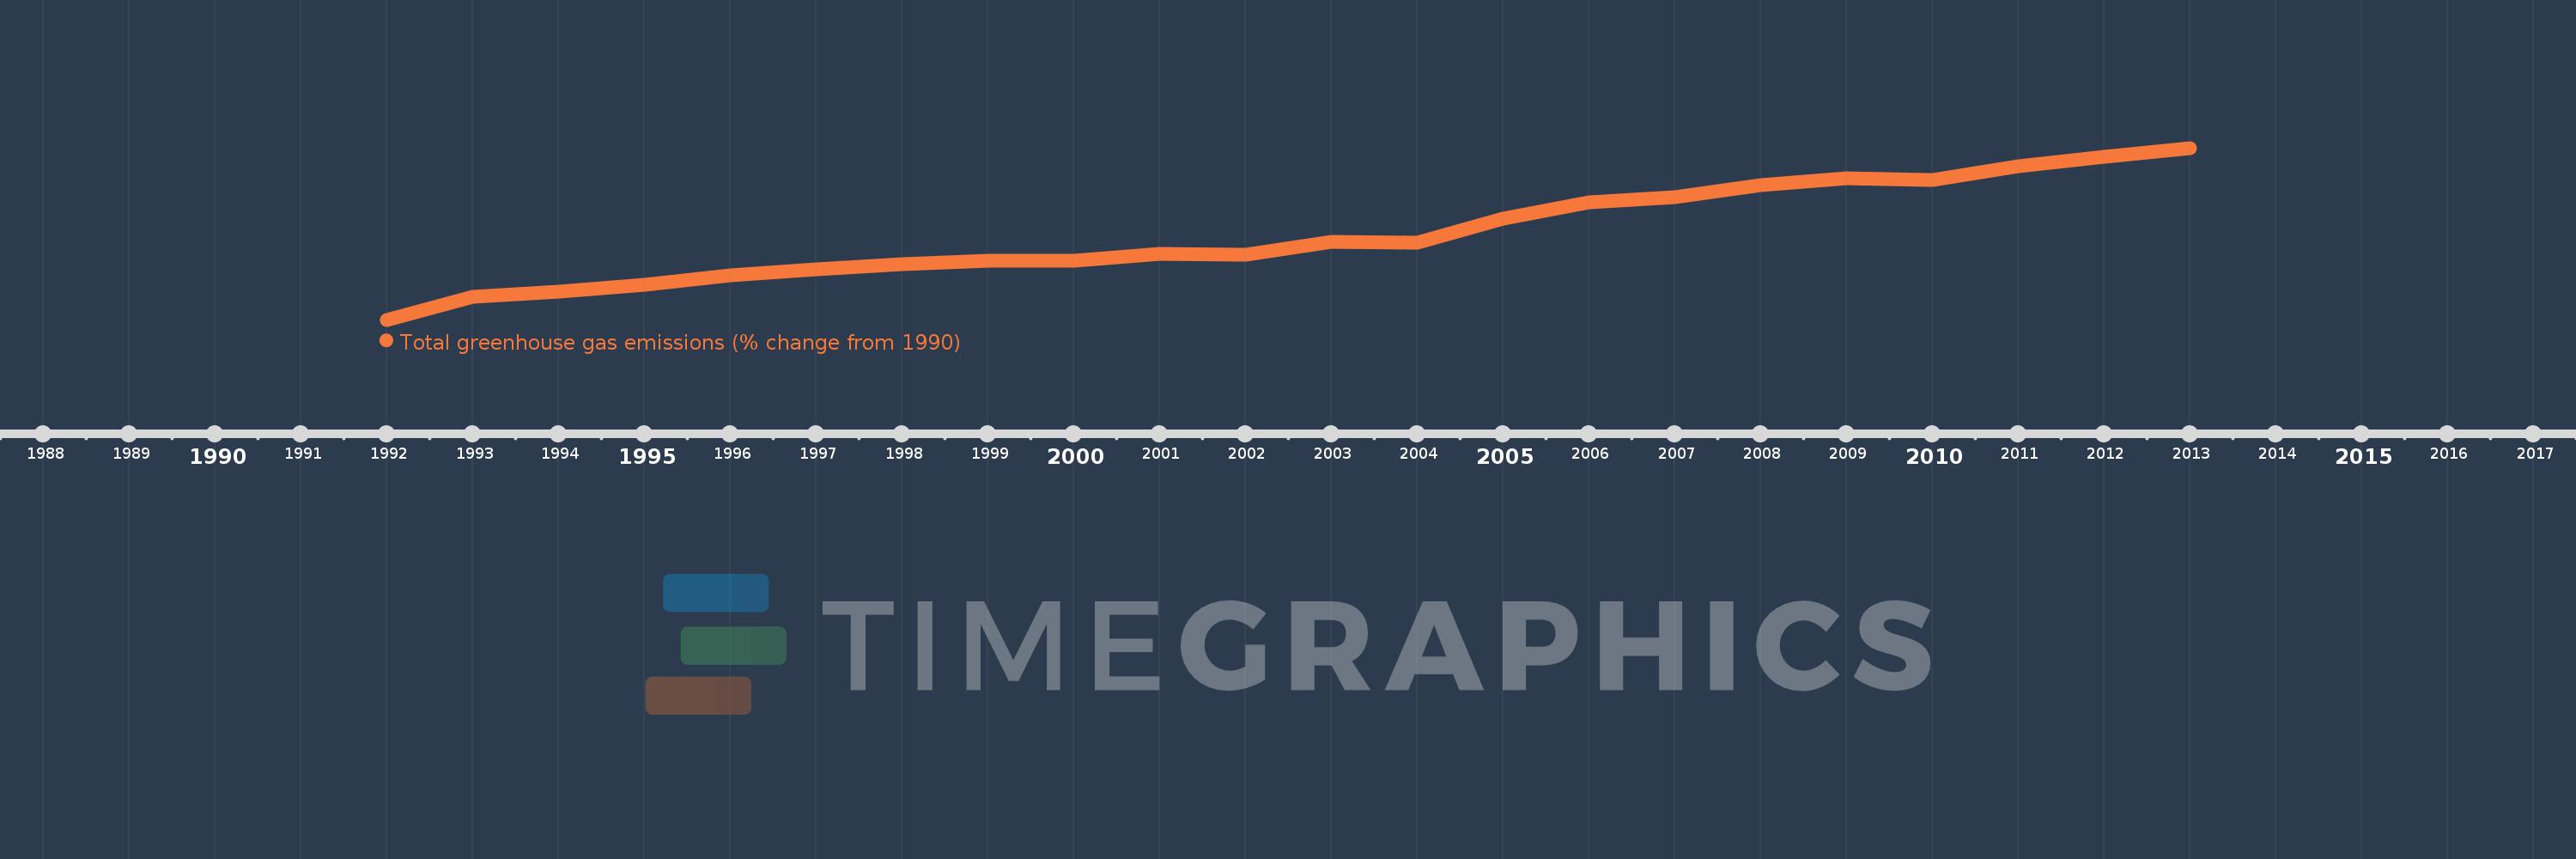
This timeline shows a graph from 1992 to 2013 of Jordan. No data until 1991. Number of actual observations by date: 22.
Source name:
World Development Indicators
Source organization:
World Bank staff estimates from original source: European Commission, Joint Research Centre (JRC)/Netherlands Environmental Assessment Agency (PBL). Emission Database for Global Atmospheric Research (EDGAR): http://edgar.jrc.ec.europa.eu/.
Categories, topics:
Climate Change, Environment
Last updated:
apr 23, 2017
Indicators value changes by year
Meaning:
68.364
Minimum:
2.529
jan 1, 1992
Maximum:
134.484
jan 1, 2013
At the date of observation
Value
Absolute change
Change from the previous value
jan 1, 1992
2.529
+2.529
0.0%
jan 1, 1993
20.169
+17.64
697.51%
jan 1, 1994
24.429
+4.26
21.12%
jan 1, 1995
29.594
+5.165
21.14%
jan 1, 1996
36.509
+6.914
23.36%
jan 1, 1997
41.437
+4.929
13.5%
jan 1, 1998
45.102
+3.664
8.84%
jan 1, 1999
47.935
+2.833
6.28%
jan 1, 2000
47.725
-0.21
-0.44%
jan 1, 2001
53.449
+5.724
11.99%
jan 1, 2002
52.228
-1.221
-2.29%
jan 1, 2003
62.377
+10.15
19.43%
jan 1, 2004
61.458
-0.919
-1.47%
jan 1, 2005
80.028
+18.57
30.22%
jan 1, 2006
92.595
+12.567
15.7%
jan 1, 2007
96.762
+4.167
4.5%
jan 1, 2008
106.052
+9.289
9.6%
jan 1, 2009
110.953
+4.901
4.62%
jan 1, 2010
109.63
-1.323
-1.19%
jan 1, 2011
120.617
+10.987
10.02%
jan 1, 2012
127.951
+7.334
6.08%
jan 1, 2013
134.484
+6.533
5.11%
Ranking of countries by current statistics by years