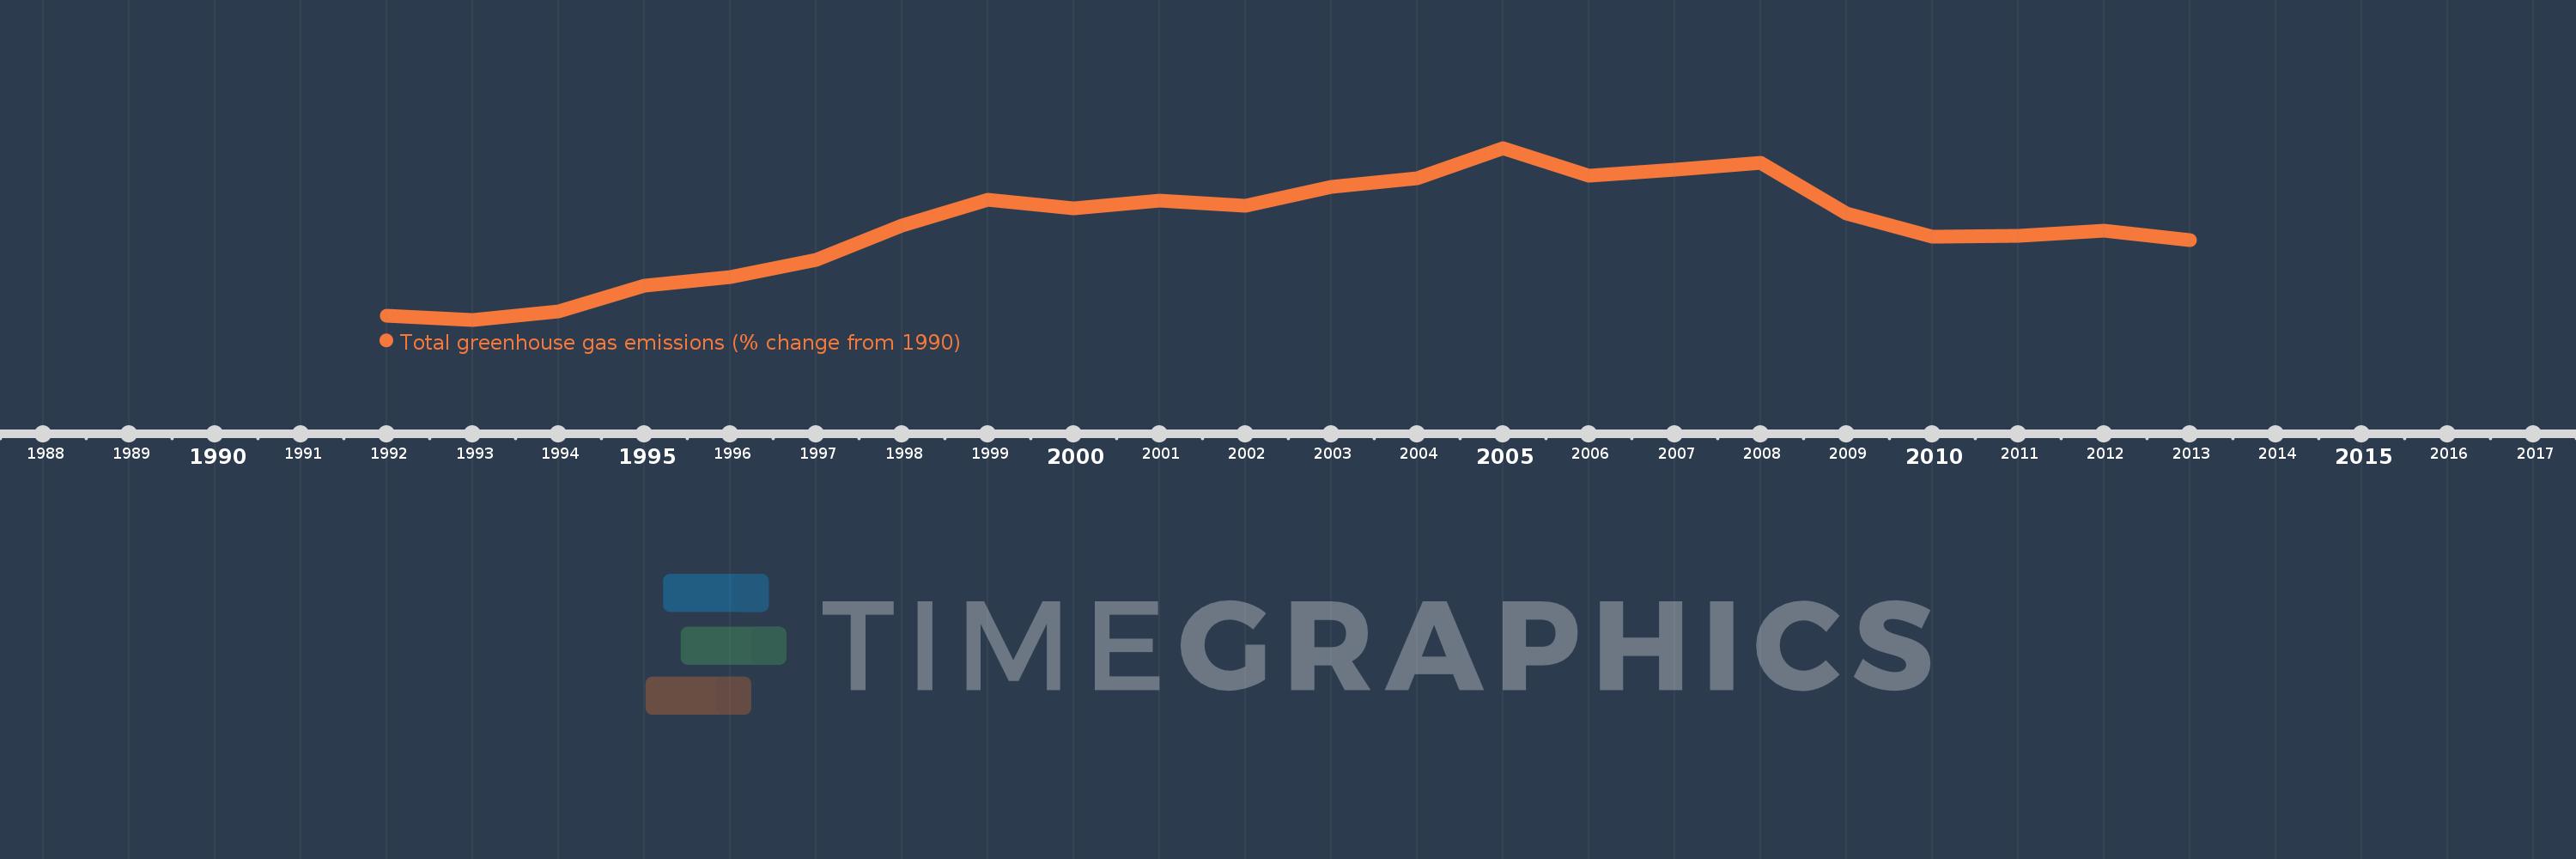
This timeline shows a graph from 1992 to 2013 of OECD members. No data until 1991. Number of actual observations by date: 22.
Source name:
World Development Indicators
Source organization:
World Bank staff estimates from original source: European Commission, Joint Research Centre (JRC)/Netherlands Environmental Assessment Agency (PBL). Emission Database for Global Atmospheric Research (EDGAR): http://edgar.jrc.ec.europa.eu/.
Categories, topics:
Climate Change, Environment
Last updated:
apr 23, 2017
Indicators value changes by year
Meaning:
8.956
Minimum:
-0.438
jan 1, 1993
Maximum:
16.908
jan 1, 2005
At the date of observation
Value
Absolute change
Change from the previous value
jan 1, 1992
-0.009
-0.009
0.0%
jan 1, 1993
-0.438
-0.428
4.55K%
jan 1, 1994
0.388
+0.826
-188.66%
jan 1, 1995
3.011
+2.623
675.63%
jan 1, 1996
3.863
+0.852
28.29%
jan 1, 1997
5.582
+1.719
44.51%
jan 1, 1998
9.05
+3.468
62.12%
jan 1, 1999
11.698
+2.648
29.26%
jan 1, 2000
10.807
-0.891
-7.62%
jan 1, 2001
11.578
+0.771
7.13%
jan 1, 2002
11.11
-0.468
-4.04%
jan 1, 2003
12.962
+1.852
16.67%
jan 1, 2004
13.881
+0.919
7.09%
jan 1, 2005
16.908
+3.027
21.81%
jan 1, 2006
14.12
-2.788
-16.49%
jan 1, 2007
14.697
+0.577
4.08%
jan 1, 2008
15.44
+0.743
5.05%
jan 1, 2009
10.291
-5.149
-33.35%
jan 1, 2010
7.989
-2.302
-22.37%
jan 1, 2011
8.009
+0.02
0.26%
jan 1, 2012
8.531
+0.522
6.52%
jan 1, 2013
7.575
-0.957
-11.21%
Ranking of countries by current statistics by years