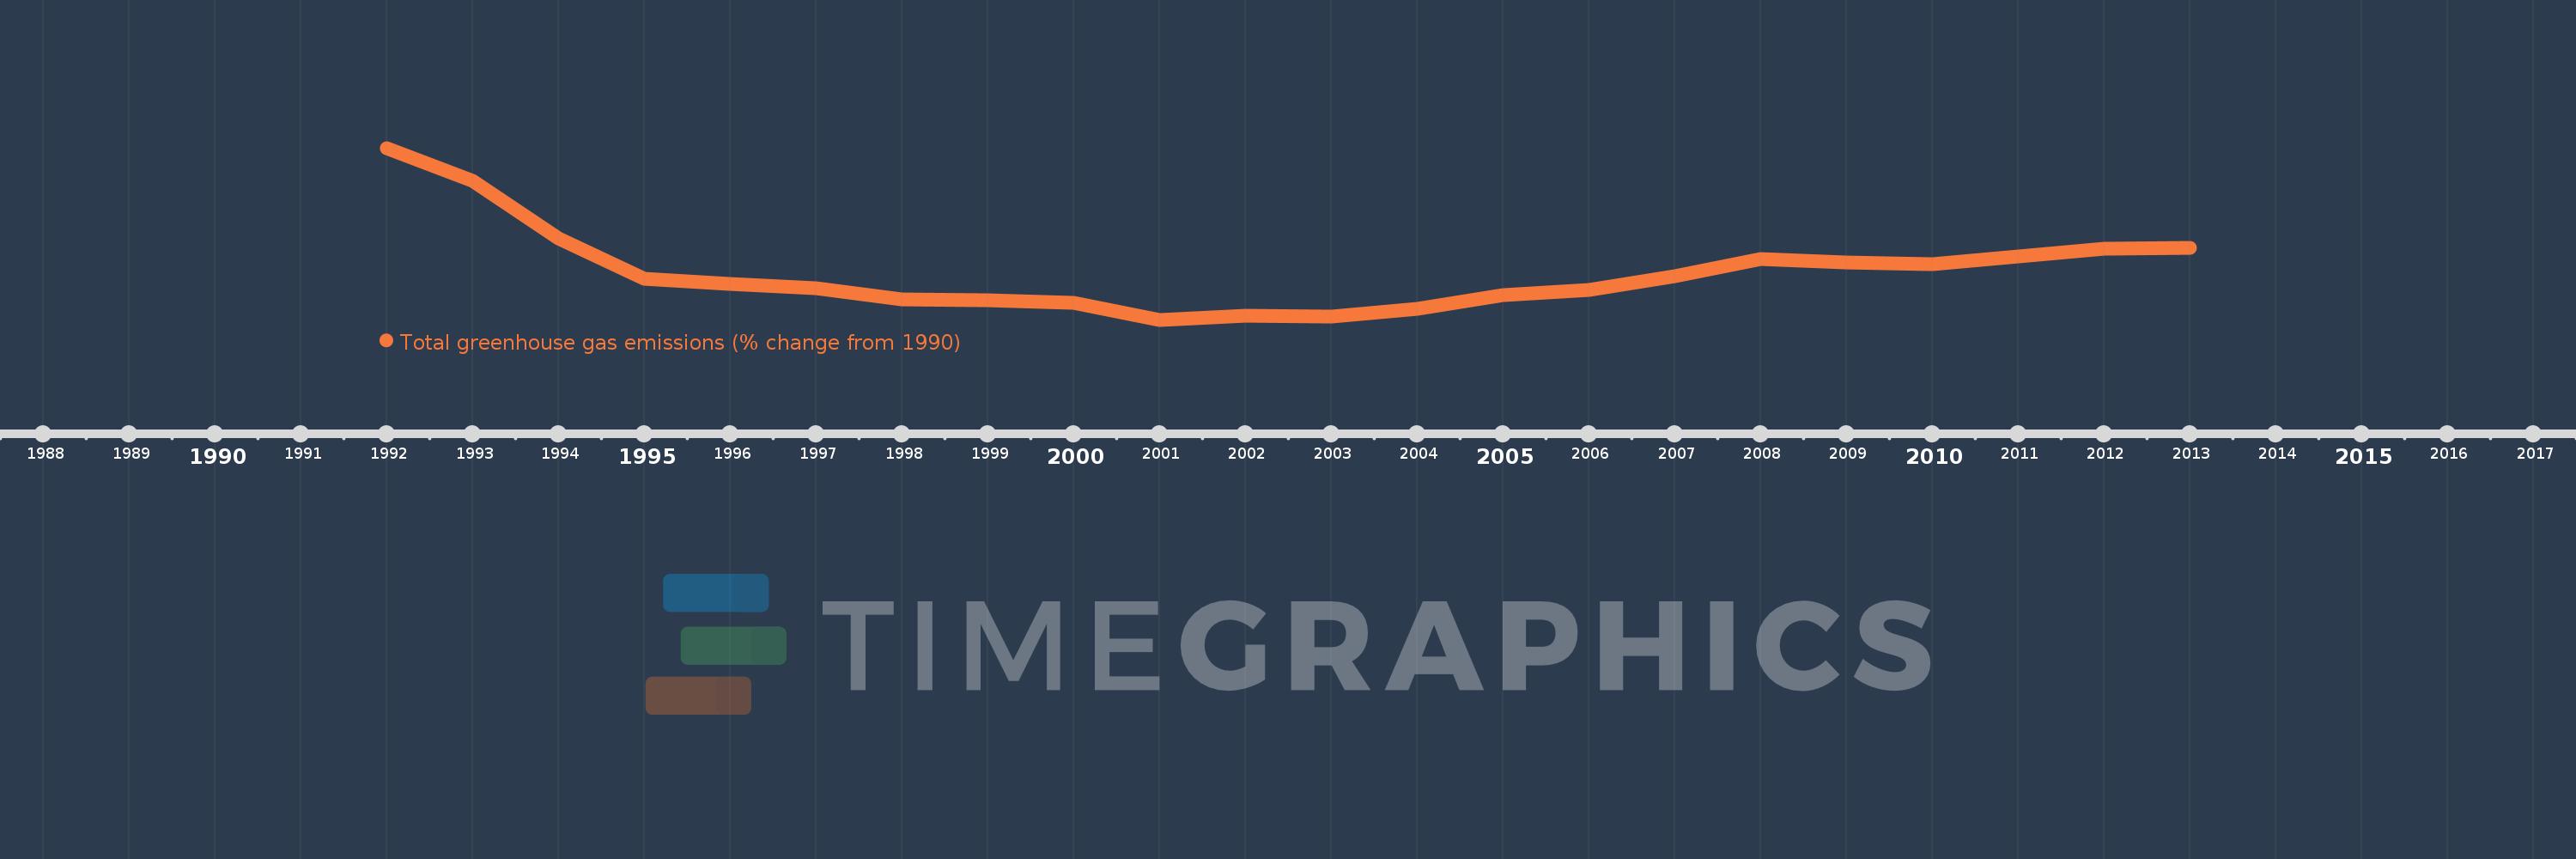
This timeline shows a graph from 1992 to 2013 of Tajikistan. No data until 1991. Number of actual observations by date: 22.
Source name:
World Development Indicators
Source organization:
World Bank staff estimates from original source: European Commission, Joint Research Centre (JRC)/Netherlands Environmental Assessment Agency (PBL). Emission Database for Global Atmospheric Research (EDGAR): http://edgar.jrc.ec.europa.eu/.
Categories, topics:
Climate Change, Environment
Last updated:
apr 23, 2017
Indicators value changes by year
Meaning:
-37.337
Minimum:
-53.575
jan 1, 2001
Maximum:
4.584
jan 1, 1992
At the date of observation
Value
Absolute change
Change from the previous value
jan 1, 1992
4.584
+4.584
0.0%
jan 1, 1993
-6.554
-11.138
-242.99%
jan 1, 1994
-25.916
-19.362
295.4%
jan 1, 1995
-39.742
-13.825
53.35%
jan 1, 1996
-41.316
-1.574
3.96%
jan 1, 1997
-42.883
-1.567
3.79%
jan 1, 1998
-46.812
-3.929
9.16%
jan 1, 1999
-46.869
-0.057
0.12%
jan 1, 2000
-47.701
-0.832
1.78%
jan 1, 2001
-53.575
-5.874
12.31%
jan 1, 2002
-52.161
+1.414
-2.64%
jan 1, 2003
-52.37
-0.208
0.4%
jan 1, 2004
-50.006
+2.364
-4.51%
jan 1, 2005
-45.162
+4.844
-9.69%
jan 1, 2006
-43.613
+1.549
-3.43%
jan 1, 2007
-38.896
+4.717
-10.81%
jan 1, 2008
-32.934
+5.962
-15.33%
jan 1, 2009
-34.121
-1.187
3.6%
jan 1, 2010
-34.794
-0.673
1.97%
jan 1, 2011
-32.033
+2.761
-7.94%
jan 1, 2012
-29.455
+2.578
-8.05%
jan 1, 2013
-29.091
+0.363
-1.23%
Ranking of countries by current statistics by years