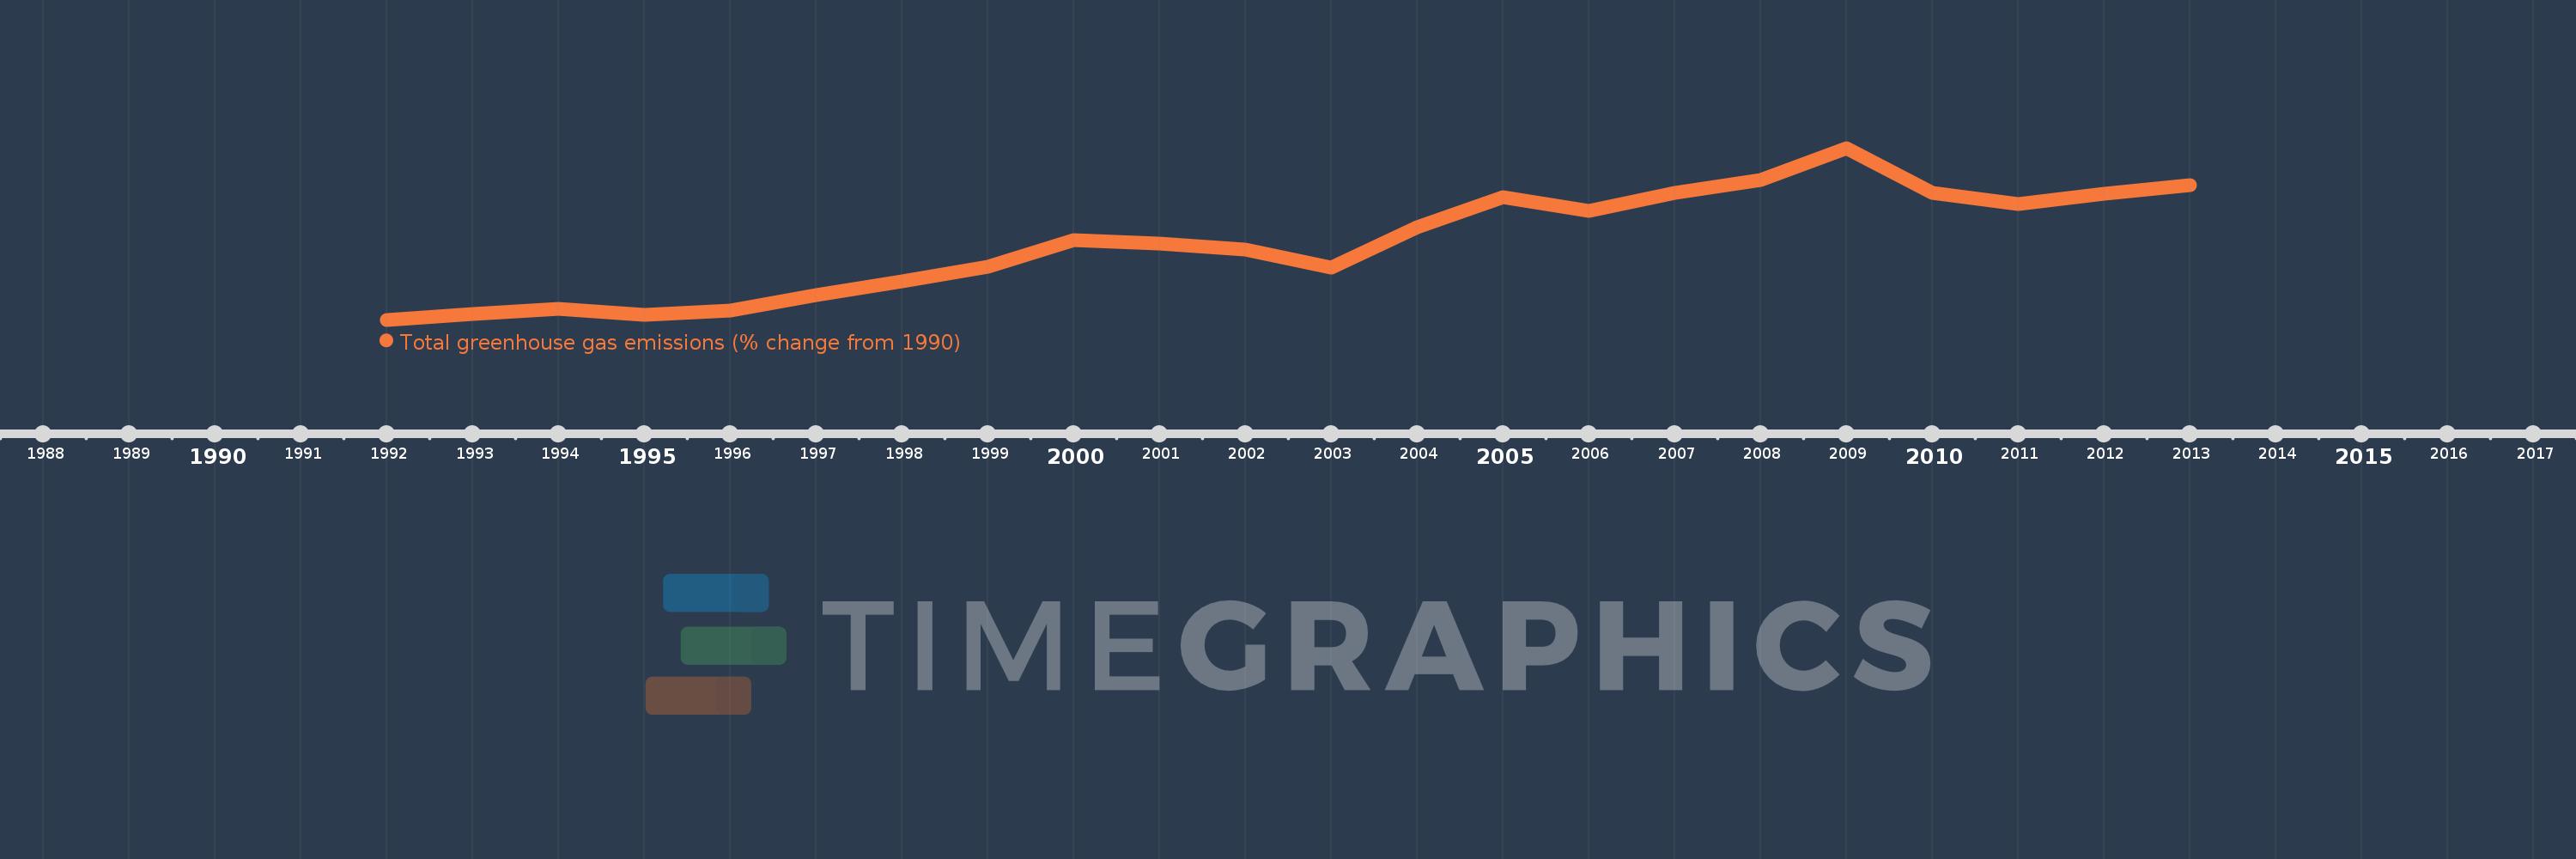
This timeline shows a graph from 1992 to 2013 of Argentina. No data until 1991. Number of actual observations by date: 22.
Source name:
World Development Indicators
Source organization:
World Bank staff estimates from original source: European Commission, Joint Research Centre (JRC)/Netherlands Environmental Assessment Agency (PBL). Emission Database for Global Atmospheric Research (EDGAR): http://edgar.jrc.ec.europa.eu/.
Categories, topics:
Climate Change, Environment
Last updated:
apr 23, 2017
Indicators value changes by year
Meaning:
24.455
Minimum:
0.238
jan 1, 1992
Maximum:
54.378
jan 1, 2009
At the date of observation
Value
Absolute change
Change from the previous value
jan 1, 1992
0.238
+0.238
0.0%
jan 1, 1993
2.095
+1.857
781.19%
jan 1, 1994
3.739
+1.645
78.5%
jan 1, 1995
1.648
-2.091
-55.92%
jan 1, 1996
3.204
+1.556
94.42%
jan 1, 1997
8.138
+4.933
153.95%
jan 1, 1998
12.438
+4.3
52.84%
jan 1, 1999
16.867
+4.429
35.61%
jan 1, 2000
25.26
+8.393
49.76%
jan 1, 2001
24.346
-0.914
-3.62%
jan 1, 2002
22.483
-1.863
-7.65%
jan 1, 2003
16.693
-5.789
-25.75%
jan 1, 2004
29.353
+12.66
75.84%
jan 1, 2005
38.787
+9.434
32.14%
jan 1, 2006
34.451
-4.336
-11.18%
jan 1, 2007
40.159
+5.708
16.57%
jan 1, 2008
44.266
+4.107
10.23%
jan 1, 2009
54.378
+10.113
22.85%
jan 1, 2010
40.087
-14.291
-26.28%
jan 1, 2011
36.814
-3.273
-8.17%
jan 1, 2012
39.886
+3.072
8.35%
jan 1, 2013
42.67
+2.784
6.98%
Ranking of countries by current statistics by years