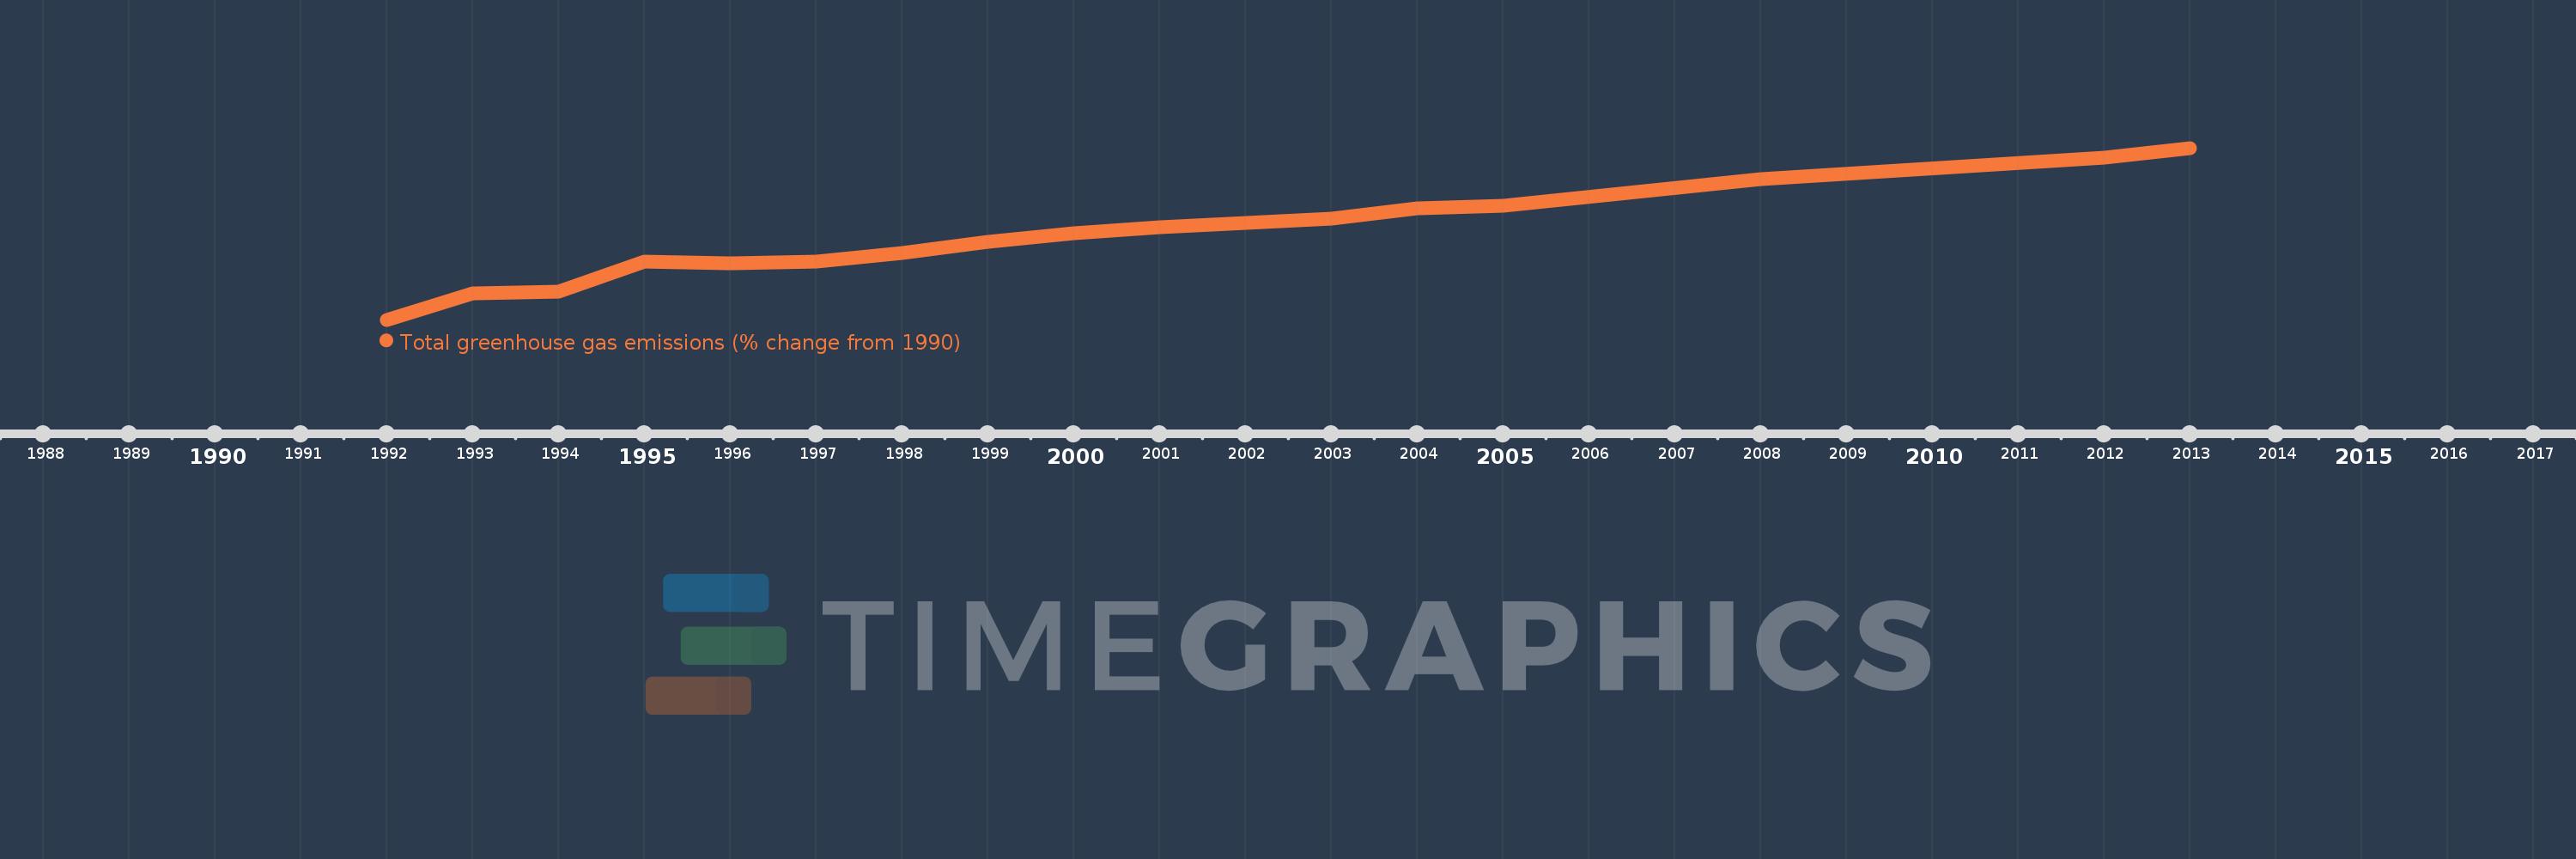
This timeline shows a graph from 1992 to 2013 of Gibraltar. No data until 1991. Number of actual observations by date: 17.
Source name:
World Development Indicators
Source organization:
World Bank staff estimates from original source: European Commission, Joint Research Centre (JRC)/Netherlands Environmental Assessment Agency (PBL). Emission Database for Global Atmospheric Research (EDGAR): http://edgar.jrc.ec.europa.eu/.
Categories, topics:
Climate Change, Environment
Last updated:
apr 23, 2017
Indicators value changes by year
Meaning:
116.561
Minimum:
37.606
jan 1, 1992
Maximum:
196.645
jan 1, 2013
At the date of observation
Value
Absolute change
Change from the previous value
jan 1, 1992
37.606
+37.606
0.0%
jan 1, 1993
61.719
+24.112
64.12%
jan 1, 1994
63.891
+2.172
3.52%
jan 1, 1995
91.57
+27.679
43.32%
jan 1, 1996
89.774
-1.796
-1.96%
jan 1, 1997
91.744
+1.97
2.19%
jan 1, 1998
99.7
+7.957
8.67%
jan 1, 1999
109.627
+9.927
9.96%
jan 1, 2000
117.583
+7.956
7.26%
jan 1, 2001
123.378
+5.795
4.93%
jan 1, 2002
127.223
+3.845
3.12%
jan 1, 2003
131.322
+4.099
3.22%
jan 1, 2004
141.135
+9.813
7.47%
jan 1, 2005
143.21
+2.076
1.47%
jan 1, 2008
167.478
+24.268
16.95%
jan 1, 2012
187.934
+20.456
12.21%
jan 1, 2013
196.645
+8.711
4.64%
Ranking of countries by current statistics by years