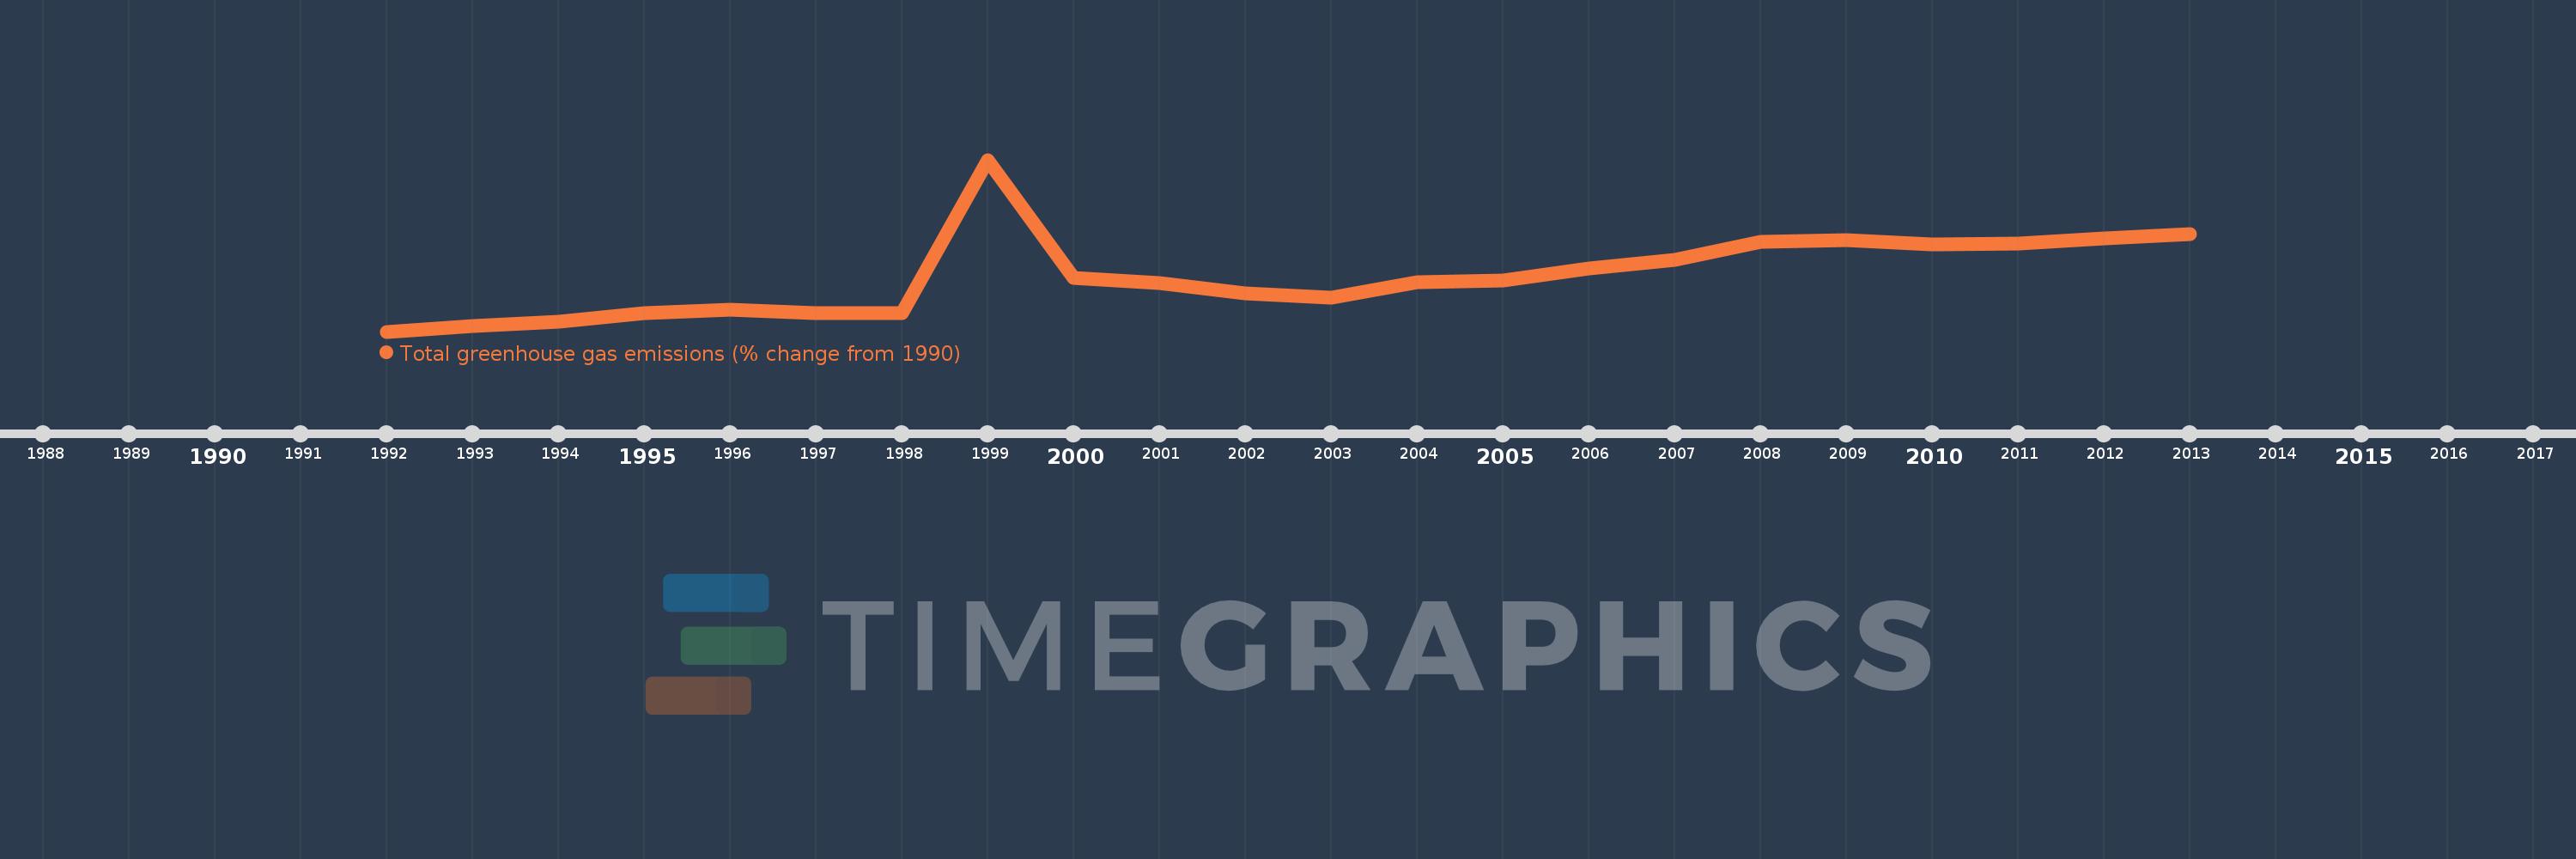
This timeline shows a graph from 1992 to 2013 of Kenya. No data until 1991. Number of actual observations by date: 22.
Source name:
World Development Indicators
Source organization:
World Bank staff estimates from original source: European Commission, Joint Research Centre (JRC)/Netherlands Environmental Assessment Agency (PBL). Emission Database for Global Atmospheric Research (EDGAR): http://edgar.jrc.ec.europa.eu/.
Categories, topics:
Climate Change, Environment
Last updated:
apr 23, 2017
Indicators value changes by year
Meaning:
21.549
Minimum:
-2.06
jan 1, 1992
Maximum:
71.006
jan 1, 1999
At the date of observation
Value
Absolute change
Change from the previous value
jan 1, 1992
-2.06
-2.06
0.0%
jan 1, 1993
0.177
+2.237
-108.59%
jan 1, 1994
2.319
+2.142
1.21K%
jan 1, 1995
5.971
+3.651
157.43%
jan 1, 1996
7.332
+1.361
22.8%
jan 1, 1997
5.626
-1.706
-23.27%
jan 1, 1998
5.887
+0.261
4.63%
jan 1, 1999
71.006
+65.119
1.11K%
jan 1, 2000
20.684
-50.322
-70.87%
jan 1, 2001
18.73
-1.954
-9.45%
jan 1, 2002
14.053
-4.677
-24.97%
jan 1, 2003
12.433
-1.62
-11.53%
jan 1, 2004
18.914
+6.481
52.13%
jan 1, 2005
19.518
+0.605
3.2%
jan 1, 2006
24.956
+5.437
27.86%
jan 1, 2007
28.438
+3.483
13.96%
jan 1, 2008
36.235
+7.797
27.42%
jan 1, 2009
36.807
+0.572
1.58%
jan 1, 2010
34.934
-1.873
-5.09%
jan 1, 2011
35.262
+0.327
0.94%
jan 1, 2012
37.416
+2.154
6.11%
jan 1, 2013
39.439
+2.024
5.41%
Ranking of countries by current statistics by years