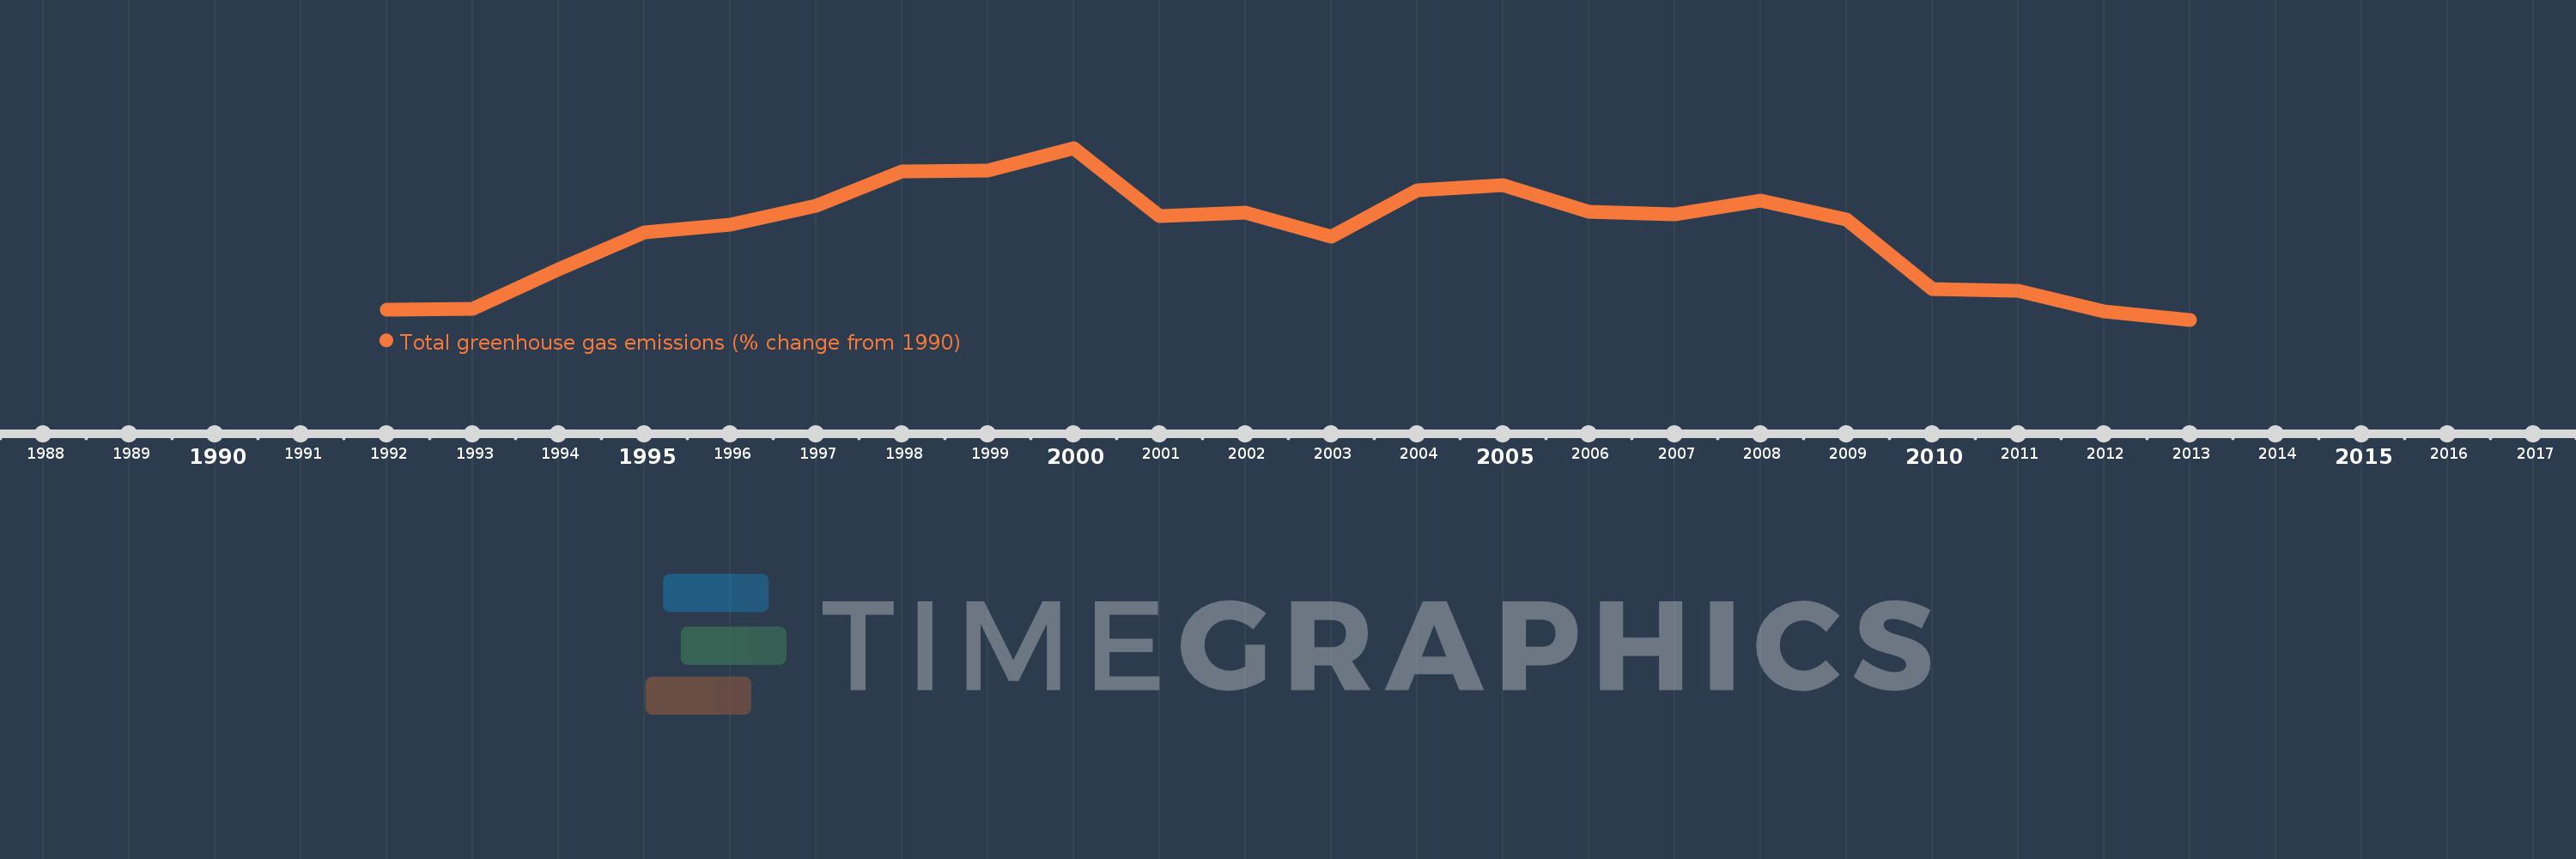
This timeline shows a graph from 1992 to 2013 of Norway. No data until 1991. Number of actual observations by date: 22.
Source name:
World Development Indicators
Source organization:
World Bank staff estimates from original source: European Commission, Joint Research Centre (JRC)/Netherlands Environmental Assessment Agency (PBL). Emission Database for Global Atmospheric Research (EDGAR): http://edgar.jrc.ec.europa.eu/.
Categories, topics:
Climate Change, Environment
Last updated:
apr 23, 2017
Indicators value changes by year
Meaning:
3.667
Minimum:
-5.824
jan 1, 2013
Maximum:
13.087
jan 1, 2000
At the date of observation
Value
Absolute change
Change from the previous value
jan 1, 1992
-4.711
-4.711
0.0%
jan 1, 1993
-4.638
+0.072
-1.54%
jan 1, 1994
-0.313
+4.326
-93.26%
jan 1, 1995
3.765
+4.077
-1.3K%
jan 1, 1996
4.599
+0.835
22.17%
jan 1, 1997
6.745
+2.146
46.65%
jan 1, 1998
10.504
+3.759
55.72%
jan 1, 1999
10.633
+0.129
1.23%
jan 1, 2000
13.087
+2.454
23.08%
jan 1, 2001
5.561
-7.526
-57.51%
jan 1, 2002
5.966
+0.405
7.29%
jan 1, 2003
3.296
-2.671
-44.76%
jan 1, 2004
8.458
+5.163
156.65%
jan 1, 2005
8.995
+0.537
6.35%
jan 1, 2006
6.095
-2.901
-32.25%
jan 1, 2007
5.765
-0.33
-5.41%
jan 1, 2008
7.32
+1.555
26.97%
jan 1, 2009
5.242
-2.078
-28.38%
jan 1, 2010
-2.409
-7.651
-145.96%
jan 1, 2011
-2.603
-0.194
8.03%
jan 1, 2012
-4.869
-2.266
87.07%
jan 1, 2013
-5.824
-0.955
19.62%
Ranking of countries by current statistics by years