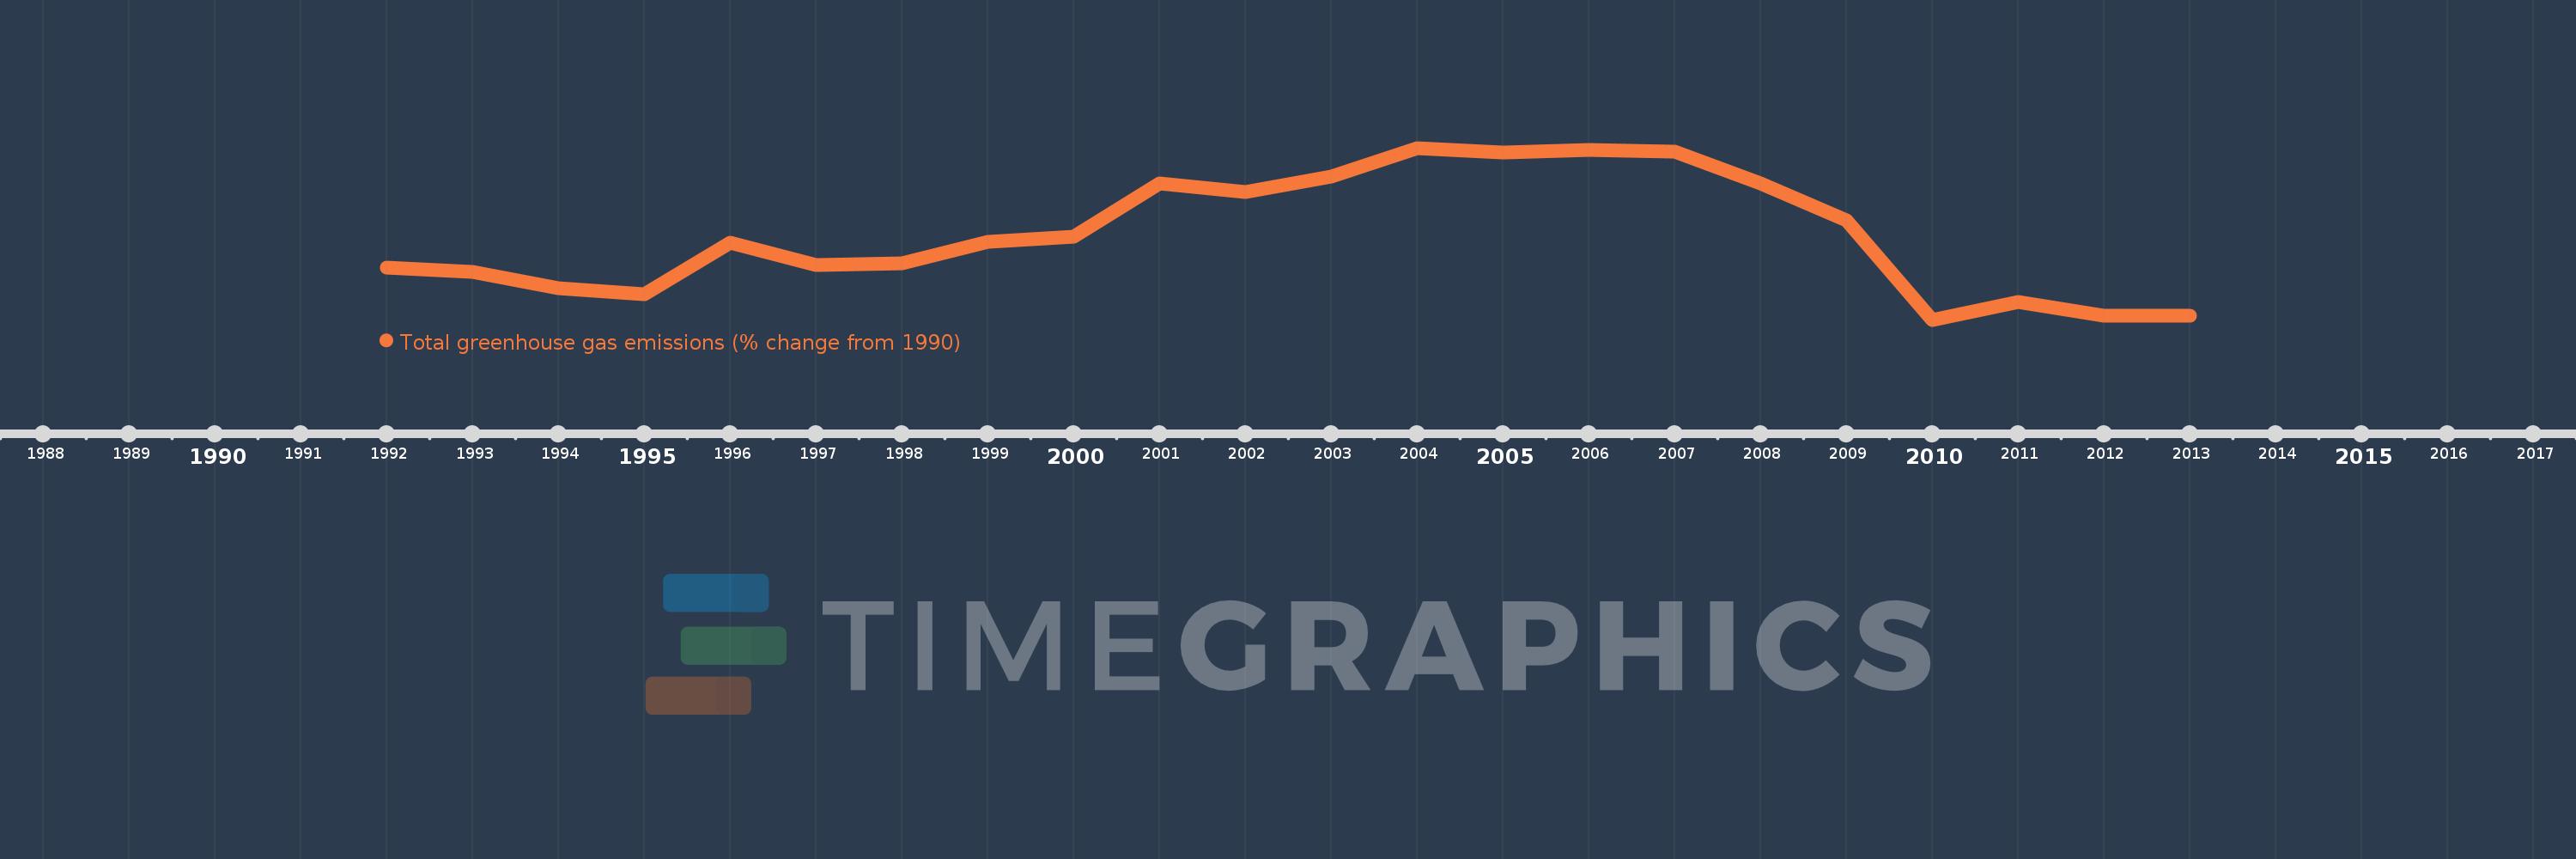
This timeline shows a graph from 1992 to 2013 of Italy. No data until 1991. Number of actual observations by date: 22.
Source name:
World Development Indicators
Source organization:
World Bank staff estimates from original source: European Commission, Joint Research Centre (JRC)/Netherlands Environmental Assessment Agency (PBL). Emission Database for Global Atmospheric Research (EDGAR): http://edgar.jrc.ec.europa.eu/.
Categories, topics:
Climate Change, Environment
Last updated:
apr 23, 2017
Indicators value changes by year
Meaning:
2.595
Minimum:
-5.517
jan 1, 2010
Maximum:
11.044
jan 1, 2004
At the date of observation
Value
Absolute change
Change from the previous value
jan 1, 1992
-0.527
-0.527
0.0%
jan 1, 1993
-0.915
-0.388
73.63%
jan 1, 1994
-2.456
-1.542
168.5%
jan 1, 1995
-3.018
-0.561
22.85%
jan 1, 1996
1.908
+4.925
-163.22%
jan 1, 1997
-0.28
-2.188
-114.69%
jan 1, 1998
-0.077
+0.203
-72.58%
jan 1, 1999
2.021
+2.098
-2.73K%
jan 1, 2000
2.498
+0.477
23.6%
jan 1, 2001
7.584
+5.086
203.65%
jan 1, 2002
6.8
-0.784
-10.34%
jan 1, 2003
8.259
+1.459
21.45%
jan 1, 2004
11.044
+2.785
33.72%
jan 1, 2005
10.62
-0.424
-3.84%
jan 1, 2006
10.879
+0.259
2.44%
jan 1, 2007
10.724
-0.155
-1.43%
jan 1, 2008
7.591
-3.133
-29.22%
jan 1, 2009
4.033
-3.558
-46.87%
jan 1, 2010
-5.517
-9.55
-236.78%
jan 1, 2011
-3.794
+1.722
-31.22%
jan 1, 2012
-5.139
-1.345
35.44%
jan 1, 2013
-5.136
+0.003
-0.06%
Ranking of countries by current statistics by years