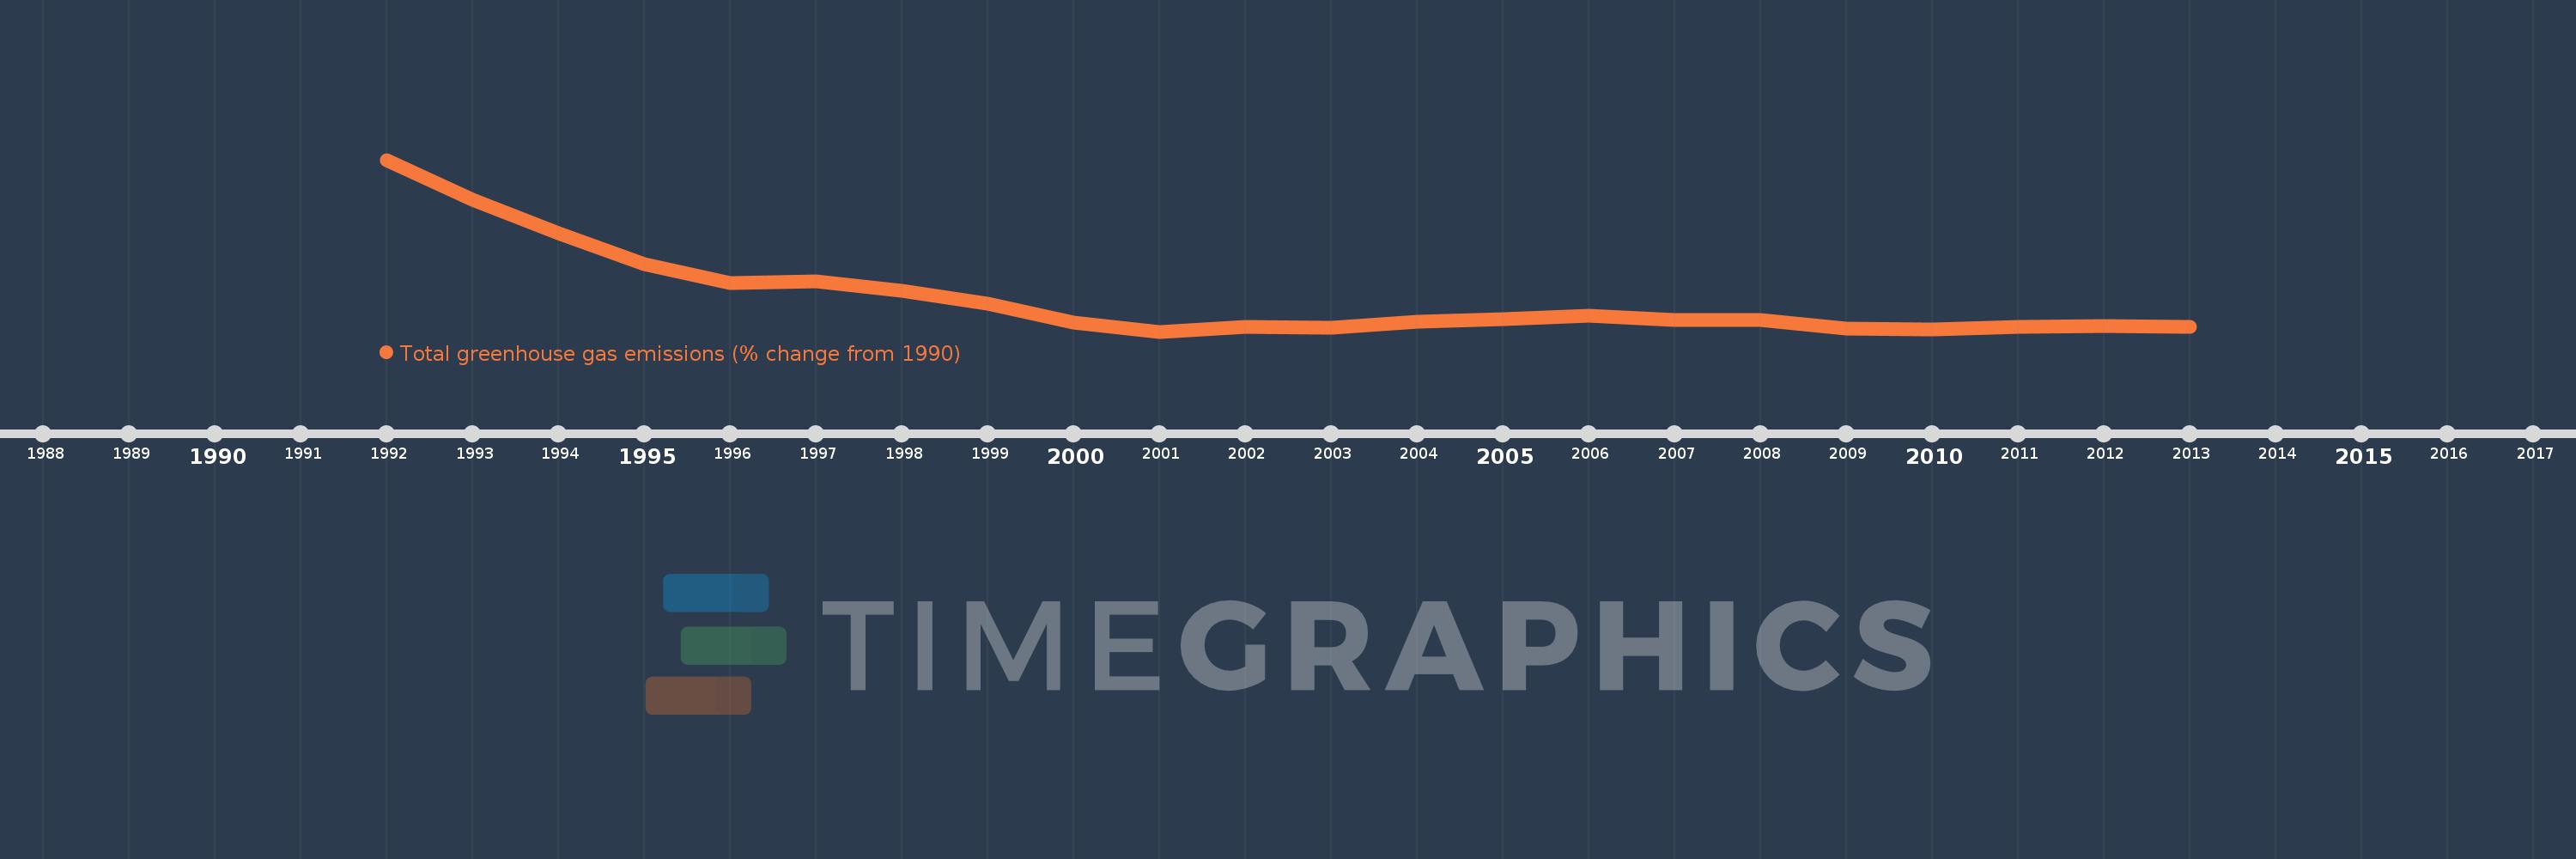
This timeline shows a graph from 1992 to 2013 of Moldova. No data until 1991. Number of actual observations by date: 22.
Source name:
World Development Indicators
Source organization:
World Bank staff estimates from original source: European Commission, Joint Research Centre (JRC)/Netherlands Environmental Assessment Agency (PBL). Emission Database for Global Atmospheric Research (EDGAR): http://edgar.jrc.ec.europa.eu/.
Categories, topics:
Climate Change, Environment
Last updated:
apr 23, 2017
Indicators value changes by year
Meaning:
-60.933
Minimum:
-71.611
jan 1, 2001
Maximum:
-16.786
jan 1, 1992
At the date of observation
Value
Absolute change
Change from the previous value
jan 1, 1992
-16.786
-16.786
0.0%
jan 1, 1993
-29.441
-12.654
75.39%
jan 1, 1994
-40.114
-10.674
36.26%
jan 1, 1995
-50.003
-9.888
24.65%
jan 1, 1996
-56.214
-6.211
12.42%
jan 1, 1997
-55.522
+0.691
-1.23%
jan 1, 1998
-58.611
-3.089
5.56%
jan 1, 1999
-62.644
-4.033
6.88%
jan 1, 2000
-68.817
-6.172
9.85%
jan 1, 2001
-71.611
-2.795
4.06%
jan 1, 2002
-70.097
+1.514
-2.11%
jan 1, 2003
-70.34
-0.243
0.35%
jan 1, 2004
-68.456
+1.885
-2.68%
jan 1, 2005
-67.65
+0.806
-1.18%
jan 1, 2006
-66.44
+1.21
-1.79%
jan 1, 2007
-67.805
-1.365
2.05%
jan 1, 2008
-68.015
-0.21
0.31%
jan 1, 2009
-70.628
-2.613
3.84%
jan 1, 2010
-71.052
-0.425
0.6%
jan 1, 2011
-70.185
+0.868
-1.22%
jan 1, 2012
-69.935
+0.249
-0.36%
jan 1, 2013
-70.153
-0.218
0.31%
Ranking of countries by current statistics by years