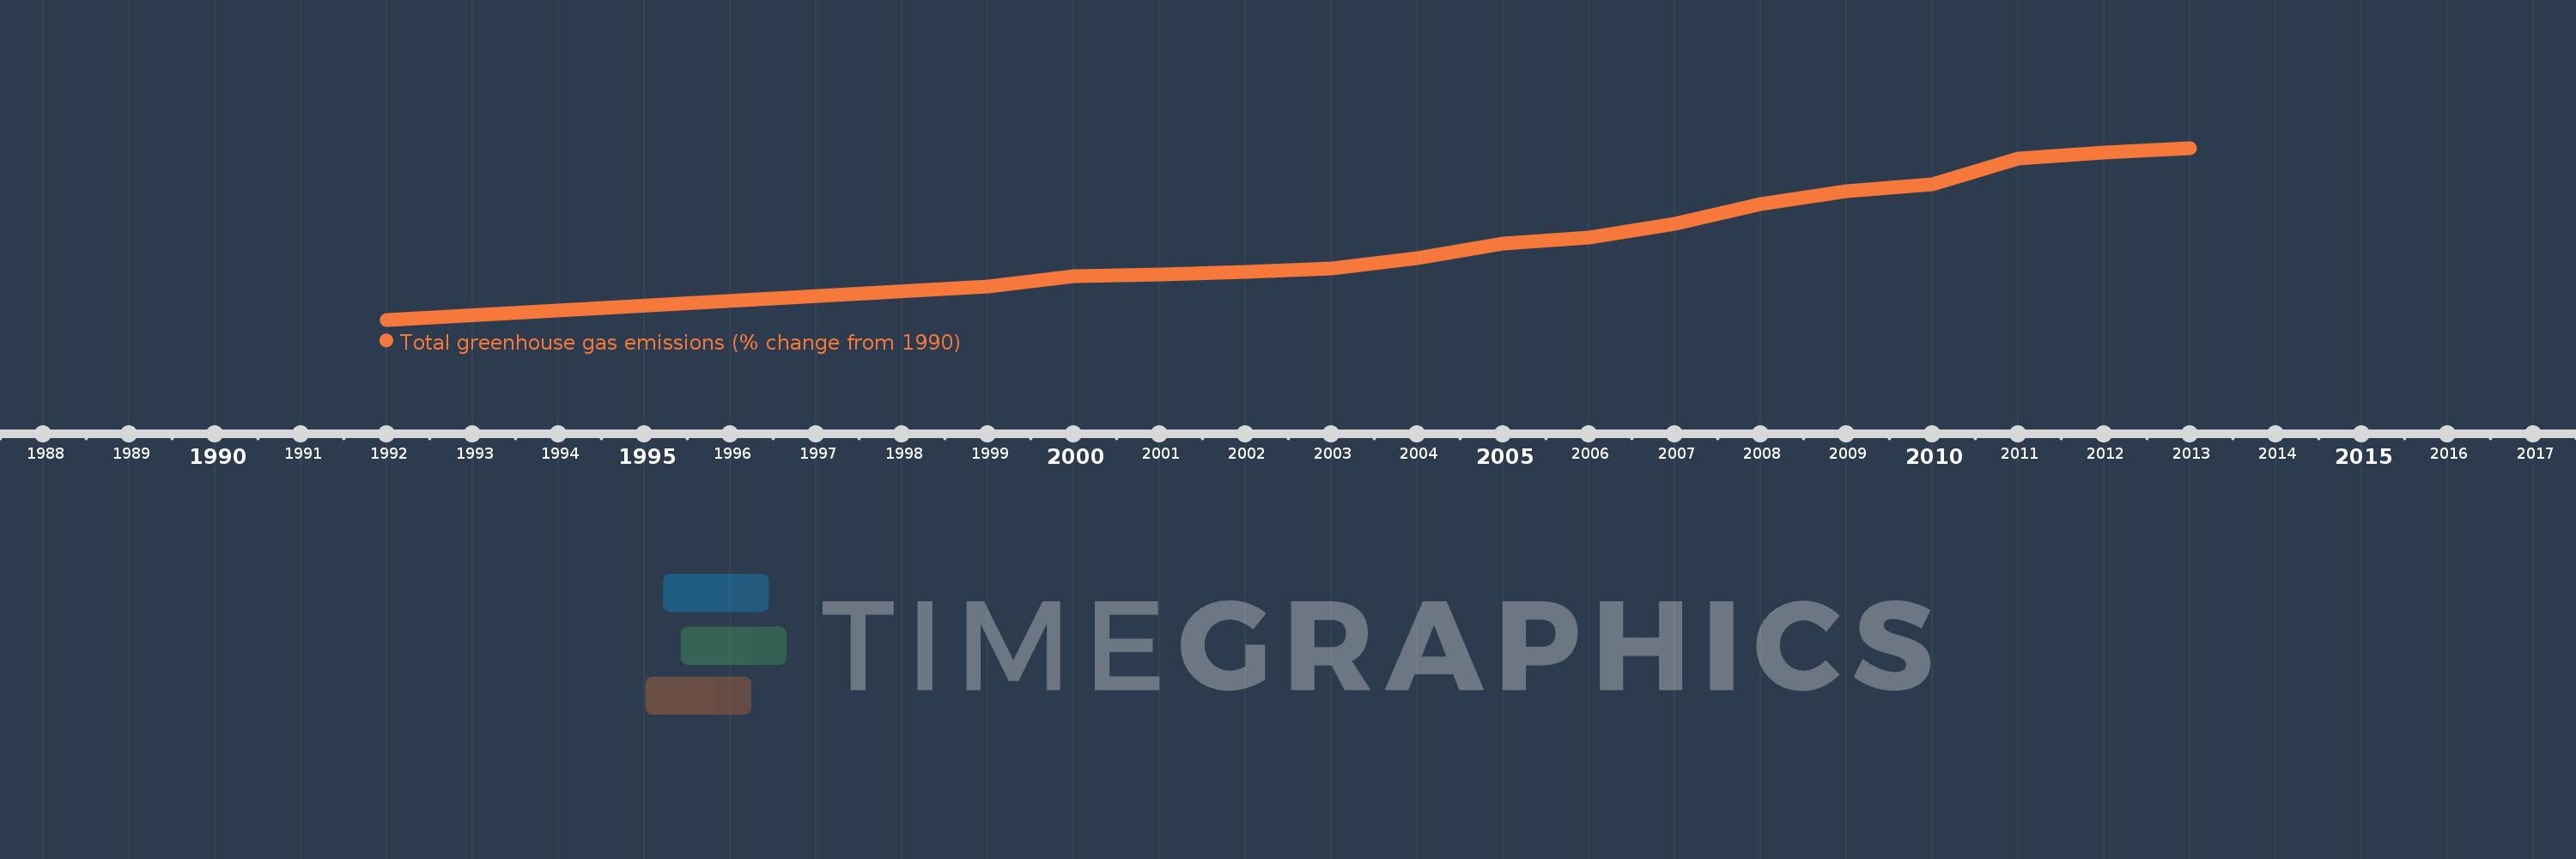
This timeline shows a graph from 1992 to 2013 of Qatar. No data until 1991. Number of actual observations by date: 16.
Source name:
World Development Indicators
Source organization:
World Bank staff estimates from original source: European Commission, Joint Research Centre (JRC)/Netherlands Environmental Assessment Agency (PBL). Emission Database for Global Atmospheric Research (EDGAR): http://edgar.jrc.ec.europa.eu/.
Categories, topics:
Climate Change, Environment
Last updated:
apr 23, 2017
Indicators value changes by year
Meaning:
193.39
Minimum:
6.096
jan 1, 1992
Maximum:
369.346
jan 1, 2013
At the date of observation
Value
Absolute change
Change from the previous value
jan 1, 1992
6.096
+6.096
0.0%
jan 1, 1999
76.285
+70.189
1.15K%
jan 1, 2000
98.811
+22.527
29.53%
jan 1, 2001
102.196
+3.385
3.43%
jan 1, 2002
107.095
+4.898
4.79%
jan 1, 2003
113.772
+6.678
6.24%
jan 1, 2004
135.604
+21.832
19.19%
jan 1, 2005
167.66
+32.056
23.64%
jan 1, 2006
179.313
+11.654
6.95%
jan 1, 2007
209.729
+30.416
16.96%
jan 1, 2008
250.96
+41.231
19.66%
jan 1, 2009
278.322
+27.361
10.9%
jan 1, 2010
292.328
+14.007
5.03%
jan 1, 2011
347.672
+55.344
18.93%
jan 1, 2012
359.046
+11.374
3.27%
jan 1, 2013
369.346
+10.3
2.87%
Ranking of countries by current statistics by years